
Ventura County Real Estate Market Update: January 2026

Overall, the Ventura County real estate market January 2026 opened the year with a familiar mix of opportunity and selectiveness: buyers are active, sellers are still benefiting from long-term demand, and the market is rewarding accuracy more than optimism. Additionally, January is a transition month that often reveals what spring will feel like—because fresh inventory starts to appear, buyer urgency normalizes after the holidays, and negotiation leverage becomes more sensitive to price, condition, and financing terms. However, countywide headlines never tell the full story unless you also look at city-by-city behavior across Camarillo, Thousand Oaks, Westlake Village, Oxnard, Ventura, Moorpark, and Simi Valley.
Furthermore, this update is built to be data-driven and practical, not vague. Moreover, the MLS numbers below anchor the month’s reality and make it easy to compare cities and price tiers. Consequently, you can use these benchmarks to evaluate whether a specific listing is priced correctly and whether the market is trending toward more balance or more competition. Therefore, if one neighborhood feels “hotter” or “slower” than the countywide headline, the local comp set is usually the reason.
Importantly, keep this one organizing principle in mind: the Ventura County real estate market January 2026 is less about “up vs down” and more about “where and why.” Notably, some sub-markets are still competitive in pockets, while others are offering buyers more room to negotiate—often within the same city depending on neighborhood, price tier, and property condition.
Additionally, if you want a quick baseline while reading, track three pillars: pricing momentum, inventory/absorption, and the gap between list price and sold price. Meanwhile, those three pillars are still heavily influenced by affordability, which is why it helps to watch mortgage rate trends alongside local MLS reality. Consequently, you’ll see consistent emphasis on inventory levels, days on market, and negotiation behavior throughout the Ventura County real estate market January 2026 breakdown.
1. Overview: Ventura County Real Estate Market Performance in January 2026
Currently, the countywide market is best described as “selectively competitive.” Additionally, well-presented homes priced in line with recent comparable sales are still drawing meaningful traffic—especially when they land in high-demand school boundaries, offer functional layouts, and feel move-in ready. However, listings that are stretched above market or carry obvious condition risk are seeing longer timelines and more negotiation as buyers compare alternatives.
Moreover, January performance should be interpreted through both “level” and “direction.” Additionally, the level tells you where the market is right now (inventory, days on market, sale-to-list ratio). Meanwhile, the direction tells you where it’s moving (new listings and pendings). Consequently, here are the countywide MLS anchors for the Ventura County real estate market January 2026 narrative:
- Countywide median sales price (January 2026): $859,750
- Countywide closed sales (January 2026): 334
- Homes sold vs January 2025: [INSERT MLS STAT: homes sold vs January 2025]
- Active listings (end of January 2026): 1,035
- Months of supply (January 2026): 3.1 months
- Median days on market (January 2026): 46 days
- Sale-to-list price ratio (January 2026): 98.8%
Therefore, once you pair inventory with sale-to-list, you get a clean read on leverage. Thus, a 3.1-month supply suggests buyers have more options than in ultra-tight years, but a 98.8% sale-to-list ratio still indicates sellers are not broadly capitulating—especially on homes that show well and are priced correctly. Conversely, when listings sit past the local norm, leverage tends to shift quickly and concessions become more common.
For example, if closed sales remain stable while active inventory rises, the market can become healthier without becoming weak. For instance, if median days on market rises but sale-to-list stays near 99%, buyers may be more selective rather than absent. Specifically, what matters is the combination of “how long it takes” and “how much discount (if any) is needed” to reach the finish line.
Notably, comparing local conditions to broader benchmarks can help you keep perspective. Additionally, you can reference statewide housing data to see how Ventura County aligns with broader California patterns. Moreover, you can glance at national market trends to understand the narratives buyers are hearing—then ground decisions in Ventura County MLS evidence and neighborhood-level comps.
Ultimately, the Ventura County real estate market January 2026 is functioning, but it’s punishing uncertainty. Finally, that means sellers need to lead with clarity and pricing accuracy, while buyers need to lead with clean terms and well-supported offers.
2. Ventura County Home Prices and Sales Volume - January 2026
Overall, price movement in January can reflect both seasonal patterns and mix shift across price tiers. Additionally, fewer closings in the early months can amplify the impact of higher-end transactions on the median. However, even with that caveat, local pricing still gives you actionable signals—especially when you compare median price, price per square foot, and the relationship between list and sold outcomes.
Furthermore, it helps to treat “price” as a cluster of metrics rather than a single number. Moreover, median price tells you the middle of the market, while price per square foot helps you compare like-for-like across property size. Consequently, here are two practical pricing anchors for the Ventura County real estate market January 2026:
- Countywide median sold price per square foot (January 2026): $501
- Countywide average days on market (January 2026): 58 days
Therefore, these metrics reinforce a key reality: buyers are still paying for quality, but they are taking more time and negotiating harder when a home feels uncertain. Thus, a ~58-day average DOM is consistent with a market that is moving, but not rushing—especially compared to the fastest years. Nevertheless, homes that are turnkey and priced to recent comps can still move significantly faster than the countywide average.
Additionally, sales volume is the most honest indicator of how many households are actually moving. Moreover, it can fall for two very different reasons: demand can soften, or inventory can constrain choice. Consequently, the 334 closed sales in January matters most when interpreted next to the 1,035 active listings and the 3.1 months of supply.
In fact, one of the best ways to make the price conversation real for homeowners is to connect monthly conditions with a broader baseline of Ventura County home values. Indeed, homeowners often care less about whether the market is “up” and more about whether they can sell in their timeline without over-discounting or over-repairing.
Notably, the market is still dividing into two lanes: homes that are priced correctly and show well, and homes that require buyers to accept uncertainty. Additionally, the first lane often produces faster offers and firmer terms. On the other hand, the second lane tends to produce longer timelines and more concession-driven negotiations—especially when the buyer has multiple alternatives.
Ultimately, the Ventura County real estate market January 2026 continues to reward pricing discipline. Finally, that sets up the next critical question: how much inventory is coming, and where is it building?
3. Ventura County Real Estate Inventory Trends This Month
Currently, inventory is the lever that most directly changes buyer behavior. Additionally, when choices expand, buyers can slow down, compare options, and negotiate more assertively. However, when inventory is tight within a given price band, buyers tend to move faster and accept fewer concessions. Consequently, inventory trends matter just as much as pricing—because they shape competition, leverage, and the speed of decision-making.
Moreover, a 3.1-month supply reflects a market with meaningful choice, not a market in freefall. Additionally, the 98.8% sale-to-list ratio indicates sellers are still capturing most of their asking price on average, even with longer timelines. Therefore, the practical takeaway is simple: buyers can negotiate in the right situations, but sellers who price accurately can still protect their outcomes.
Importantly, the “risk-cost” conversation has become more visible in Ventura County in recent years. Additionally, buyers are underwriting hazard exposure, insurance availability, and total monthly payment more aggressively than they did in 2021–2022. Consequently, it’s smart to understand factors like Ventura County flood zones and the role of California Fair Plan insurance in the real underwriting process. Nevertheless, these topics don’t automatically lower values; they simply make buyers more sensitive to documentation, clarity, and pricing that reflects total cost.
In summary, inventory is the foundation of leverage in the Ventura County real estate market January 2026. Ultimately, city-by-city behavior tells you whether that leverage is shifting uniformly—or only in certain neighborhoods.
4. Camarillo Real Estate Market Snapshot
Overall, Camarillo tends to attract buyers who prioritize school quality, neighborhood stability, and access to key employment corridors. Additionally, that demand often supports strong performance for well-priced, turnkey homes. However, Camarillo buyers also cross-shop against Thousand Oaks, Moorpark, and parts of Ventura, which means pricing accuracy is still non-negotiable—especially when buyers can find comparable alternatives within a short drive.
Furthermore, Camarillo’s market is often easiest to understand when you separate “standout” listings from “average” listings. Moreover, homes that present cleanly online and in person tend to capture stronger initial momentum. Consequently, sellers who invest in pre-list preparation often reduce the need for future reductions and credits.
Additionally, if you want Camarillo-specific context beyond this monthly snapshot, start with the Camarillo real estate market page and then layer in your MLS figures to map micro-market behavior by neighborhood or tract.
Notably, the most common Camarillo buyer questions right now are practical: “How many choices do we have under our budget?” and “How aggressive do we need to be when a good home hits?” Additionally, those questions are best answered by the countywide inventory context plus a city-by-city comparison that helps buyers calibrate expectations.
City-by-City Comparison: Ventura County Market Snapshot (January 2026)
Here’s a practical comparison of major cities across the Ventura County real estate market January 2026. These figures reflect January 2026 MLS outcomes and help you compare pricing and speed at a glance. Pricing and speed can vary significantly by neighborhood, condition, and micro-location within each city.
| City | Median Price | Typical DOM | Market Feel |
|---|---|---|---|
| Camarillo | $840,000 | 34 days | Family-driven demand; best homes move fast when priced correctly |
| Thousand Oaks | $1,140,000 | 44 days | Competitive in pockets; condition and micro-location drive outcomes |
| Westlake Village | $1,130,000 | 50 days | Premium buyer pool; selective, documentation-focused, higher expectations |
| Ventura | $905,000 | 43 days | Coastal premium; inventory mix matters (SFR vs condo/attached) |
| Oxnard | $897,500 | 25 days | Best coastal value; condition and HOA/insurance costs change buyer math |
| Moorpark | $975,000 | 39 days | Family-oriented; scarcity in standout inventory can support strong terms |
| Simi Valley | $817,500 | 59 days | Solid demand; buyers compare hard across tracts and condition tiers |
Ultimately, Camarillo’s local story should be interpreted inside that broader comparison. Finally, that’s why the next section zooms into Thousand Oaks and Westlake Village, where premium-market dynamics often amplify selectiveness.
5. Thousand Oaks and Westlake Village Housing Update
Currently, Thousand Oaks and Westlake Village continue to behave like premium sub-markets with durable demand drivers. Additionally, these areas attract buyers prioritizing schools, lifestyle amenities, and longer-term homeownership plans. However, higher price points can amplify rate sensitivity in dollar terms, which can extend decision cycles even when buyer interest is genuine.
Moreover, the most accurate way to read these markets is to segment by price tier and property type. Additionally, turnkey single-family homes in strong micro-locations tend to capture faster attention, while “project” properties or homes testing the top of a local range require sharper pricing to create urgency. Consequently, sellers benefit from pricing to the most recent comps rather than the highest closed sale in the neighborhood.
Furthermore, for city-level navigation, reference the Thousand Oaks housing market and Westlake Village homes pages for deeper context and neighborhood breakdowns. Moreover, cross-shopping is common here, so buyers often look at alternatives in Moorpark and Simi Valley when balancing commute, schools, and total payment. Consequently, it can be useful to keep Moorpark housing trends and Simi Valley homes for sale in mind as “pressure valves” that can redirect demand when one city becomes too tight or too expensive.
Notably, negotiation behavior in Thousand Oaks and Westlake Village tends to be more term-sensitive. Additionally, buyers at higher price points often expect higher disclosure quality, smoother inspection positioning, and clearer answers on insurance and maintenance risk. Therefore, sellers who anticipate questions and remove uncertainty can frequently capture stronger terms—even if they are not the lowest-priced option on the market.
In fact, the premium lane is often where “presentation” has the highest ROI. Indeed, a clean pre-inspection posture, strong staging or decluttering, and professional photography can influence both speed and final terms. Ultimately, that’s a practical reminder that the Ventura County real estate market January 2026 is not a market where “average effort” produces top outcomes.
Finally, the next section moves to Oxnard and Ventura, where coastal dynamics, HOA math, and risk-cost awareness can shape buyer decisions in ways that differ from inland markets.
6. Oxnard and Ventura Coastal Market Analysis
Overall, coastal markets often move on a slightly different rhythm than inland neighborhoods. Additionally, proximity to the beach, harbor amenities, and lifestyle demand can support pricing even when affordability tightens. However, coastal inventory tends to include a larger share of condos, townhomes, and planned communities with HOA costs, which changes the monthly-payment equation for buyers.
Meanwhile, coastal buyers are also more likely to underwrite “total ownership cost” beyond principal and interest. Additionally, insurance availability, hazard perception, HOA dues, and maintenance expectations can influence what a buyer is willing to pay for a given property—even if the list price seems reasonable relative to comps. Consequently, sellers in coastal-adjacent submarkets benefit from clarity on insurability and from documenting improvements that reduce perceived risk.
Additionally, for deeper city-level detail, start with Oxnard real estate and Ventura real estate market. Moreover, those pages can help you frame neighborhood differences (harbor-adjacent vs inland tracts, midtown vs hillside pockets, attached vs detached supply). Therefore, your MLS data can be interpreted through the “what is actually selling” lens rather than relying on broad city averages.
Furthermore, flood-zone and storm awareness can be more prominent in certain coastal-adjacent areas. Additionally, it’s useful for buyers to understand Ventura County flood zones early so underwriting does not become a mid-escrow surprise. Consequently, buyers who handle risk-cost questions upfront can write cleaner offers and negotiate from a position of clarity.
Recently, buyers have been more willing to walk away from uncertainty if they have alternatives. Therefore, coastal sellers who provide strong disclosures and reduce unanswered questions often experience smoother escrows and stronger terms. Conversely, buyers who approach coastal purchases with disciplined due diligence are more likely to win the right home without overpaying.
Ultimately, Oxnard and Ventura illustrate a key theme of the Ventura County real estate market January 2026: lifestyle demand is real, but affordability math and risk-cost transparency determine leverage. Finally, the “right” strategy depends on whether you are selling a turnkey home with broad appeal or buying a property where due diligence will matter more than the sticker price.
7. What Buyers and Sellers Should Know Right Now
Overall, leverage in Ventura County right now is conditional and local. Additionally, it varies by price band, condition tier, and the number of comparable homes available within the buyer’s search radius. However, there are consistent patterns that help buyers and sellers make better decisions regardless of city.
What buyers should do in the next 30–90 days
Additionally, lock your financing plan and payment comfort before you treat any home as “the one.” Moreover, small differences in rate, HOA, and insurance can materially change affordability in Ventura County. Consequently, the strongest buyers are the ones who know their ceiling, can move quickly when the right listing appears, and can write offers that reduce friction for the seller.
For example, if you’re earlier-stage, explore guidance built for first-time homebuyers in Ventura County so you understand down payment options, credit strategy, and closing-cost planning. For instance, being prepared on cash-to-close often allows you to structure a cleaner offer rather than simply “offering more” in price. Therefore, preparation becomes a direct competitive advantage.
Notably, buyers should use negotiation intelligently rather than emotionally. Additionally, the best discounts typically come from well-supported offers tied to comps, days on market, and clear terms—not from random low offers that don’t match local reality. Consequently, the 46-day median DOM and 98.8% sale-to-list ratio are useful “guardrails” for how aggressive (or conservative) to be depending on the listing’s situation.
What sellers should do in the next 30–90 days
Moreover, sellers should treat listing preparation as a leverage-building step, not as “extra.” Additionally, clean presentation, strong photography, and proactive disclosure reduce uncertainty and increase buyer confidence. Consequently, those steps can reduce time on market and reduce the size of the concessions buyers ask for later.
Specifically, if you’re thinking about listing, start with a clear plan for selling a home in Ventura County that matches your timeline and your micro-market’s demand profile. Importantly, the goal is not to chase “the highest possible number”; the goal is to capture the strongest combination of price, terms, and certainty available in your neighborhood right now.
Nevertheless, sellers should also recognize that buyers are comparing more than price. Additionally, they are weighing repair risk, insurance confidence, HOA dues, and the “hassle factor” of making a home livable. Consequently, sellers who price as if the home is perfect when it isn’t often end up negotiating harder later—after days on market increases and leverage shifts.
In summary, the Ventura County real estate market January 2026 is a market where results are earned through precision: precise pricing, precise preparation, and precise offer structure. Ultimately, whether you are buying or selling, the best move is to act with information rather than assumptions.
8. Ventura County Real Estate Forecast: February 2026 and Beyond
Overall, February is typically where spring momentum starts to build. Additionally, more listings tend to hit the market, buyer activity becomes more consistent, and the market begins to reveal whether inventory is rising fast enough to create more balance. However, the pace of that ramp depends heavily on affordability, seller willingness to move, and how quickly buyers convert from browsing to writing offers.
Consequently, the best forecast is a “watchlist,” not a single prediction. Additionally, track a short set of indicators weekly and adjust strategy in real time. Therefore, if you plan to update this post next month, monitor new listings, new pendings, active inventory change, and the early-month DOM and sale-to-list behavior by city.
Moreover, city-level cross-shopping will remain an important dynamic. Additionally, when Camarillo tightens, some buyers shift to Moorpark or Simi Valley for more space or different price thresholds. Conversely, when coastal inventory expands, some inland buyers will consider Oxnard or Ventura for lifestyle value—especially when the payment difference narrows. Consequently, keeping an eye on each city’s “alternative set” is one of the most practical ways to forecast near-term behavior.
Additionally, population and household formation trends remain long-run support for demand. Moreover, you can reference Ventura County population data for demographic context, even though near-term pricing and activity are still mostly driven by inventory and affordability. Thus, the market’s next move will likely come from whether inventory expands without forcing sellers into broad discounting.
Finally, if you want a personalized, neighborhood-specific read—pricing, timing, and how to negotiate in your exact micro-market—reach out and I’ll map it out based on your goals and the most recent local comps. The Ventura County real estate market January 2026 is a market where smart planning creates leverage, and the right strategy can save real money (or protect real equity) even when headlines feel noisy.
About the Author

Zac Wasserman (CA DRE# 02210760) – RE/MAX ONE
Straight-talk guidance for Ventura County and Los Angeles County buyers and sellers.
Phone/Text: 805.212.9147
Website: zacwasserman.goldnationsocal.com
Email: ZacSellsCA@gmail.com
- All Posts
- Buyer Guides
- California Home Insurance & Wildfire Risk
- Home Financing (Mortgage & Loan Guides)
- Market Updates & Forecasts
- Seller Guides
- Back
- Ventura County Real Estate Market Updates
- San Fernando Valley Real Estate Market Updates (Monthly): Prices, Inventory & Trends

Ventura County Mortgage Rates: September 2026 Update September 2026 Mortgage Update Ventura County Mortgage Rates: September 2026 Update Rates have...

Can You Sell an ADU Separately in California? Your 2026 AB 1033 Guide for LA & Ventura County Sell an...
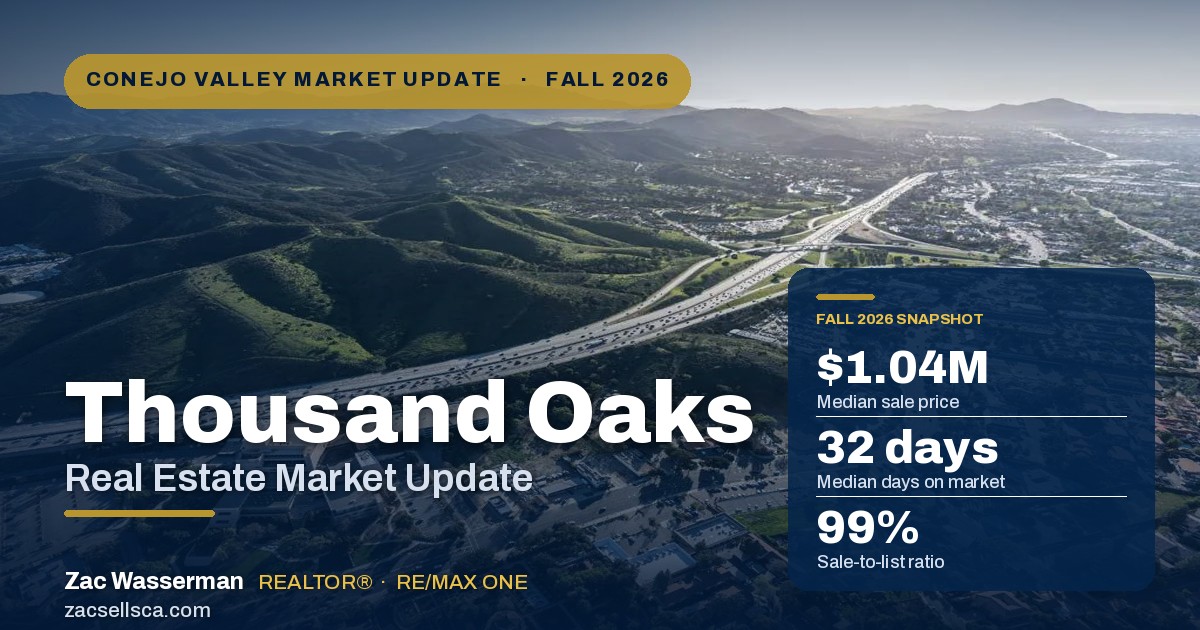
Conejo Valley Market Update · Fall 2026 Thousand Oaks Real Estate Market Update: Fall 2026 Prices remain firm, inventory is...
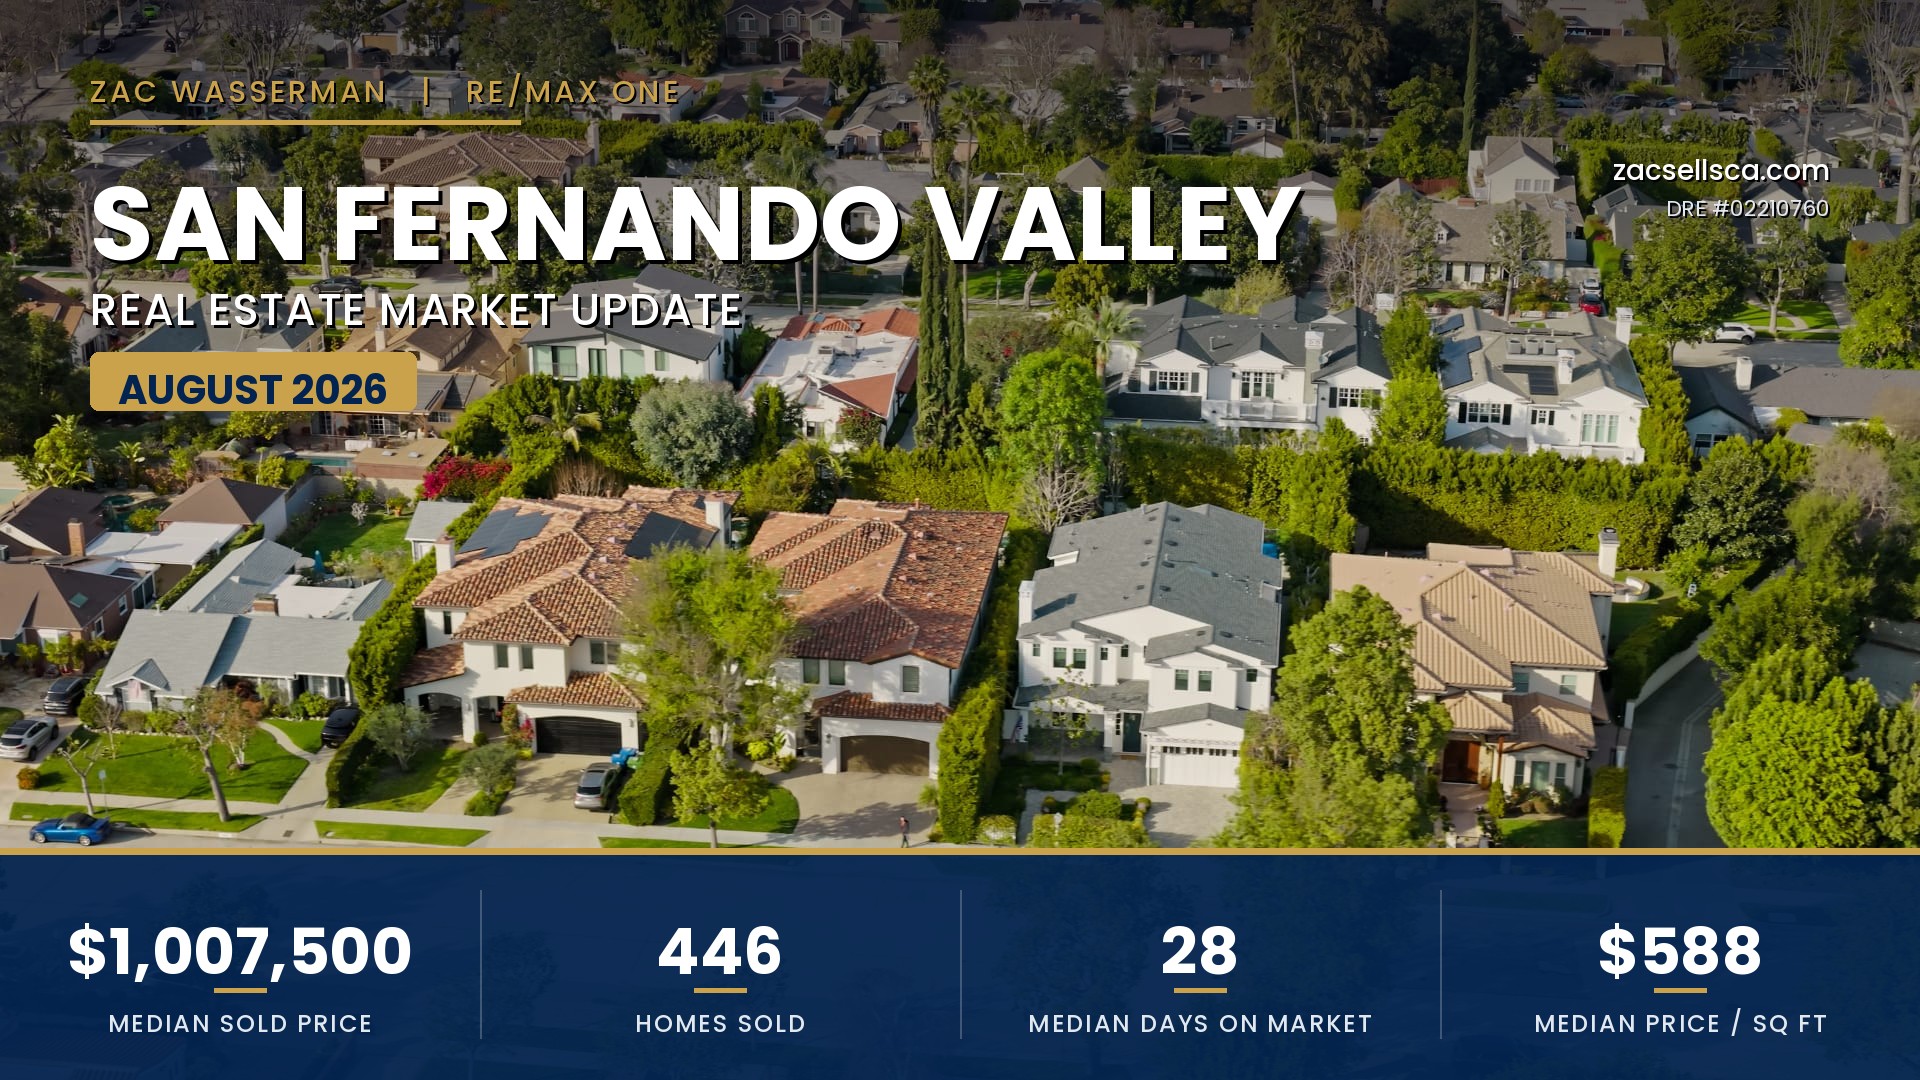
August 2026 • Local Market Report San Fernando Valley Housing Market Update: August 2026 Prices, Trends & City-by-City Data By...
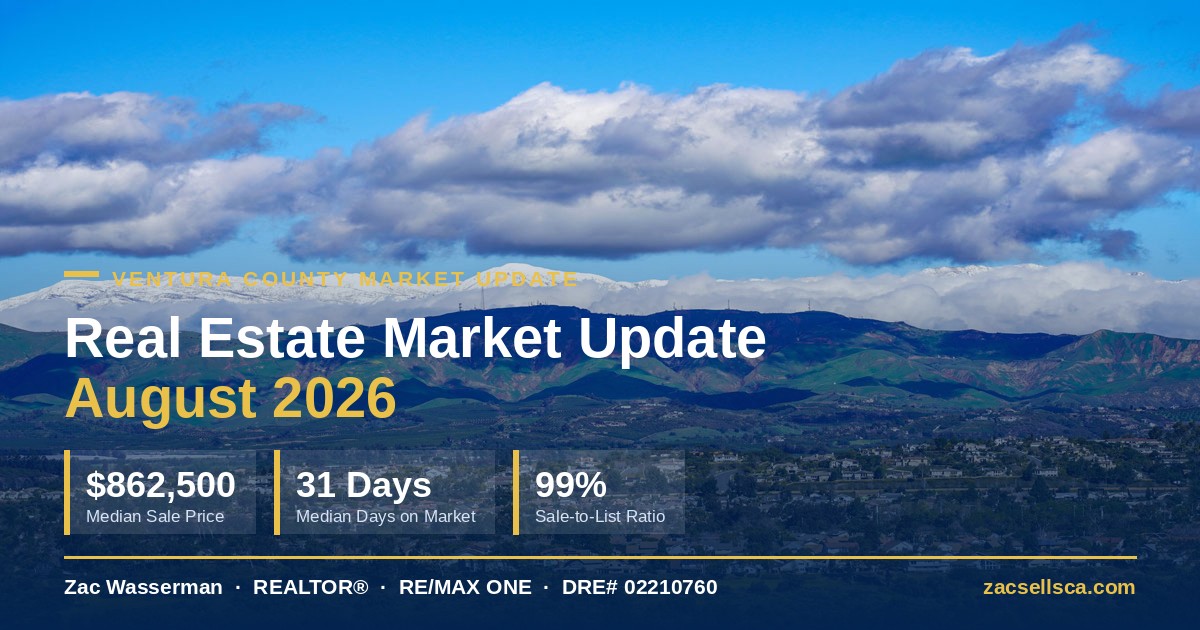
Ventura County Real Estate Market Update: August 2026 Ventura County Market Update — August 2026 Ventura County Real Estate Market...

Ventura County Real Estate Guide • 2026 Ventura County Foreclosures in 2026: How to Buy Smart or Sell Fast A...