
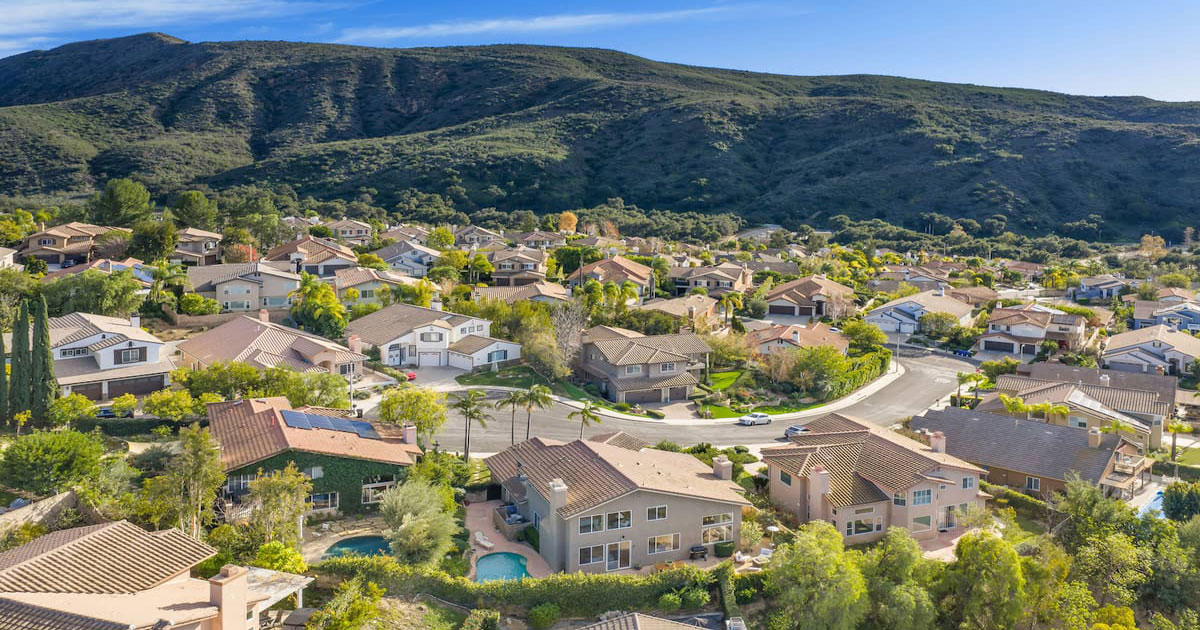
Ventura County Real Estate Market Update: July 2026
Real closed-sale MLS data, city-by-city pricing, and a clear explanation of what July’s numbers mean for Ventura County buyers and sellers.
If you have been watching home prices this summer, the July numbers are in — and this Ventura County real estate market update for July 2026 cuts through the noise with real closed-sale data, not estimates. Across the county, 553 residential properties closed escrow in July, and the story they tell is one of a market that has settled into a steadier, more balanced rhythm than the frenzy of years past. The median home price landed at $872,000, homes took a median of 31 days to sell, and sellers collected 99% of their asking price on average. Therefore, whether you are buying, selling, or simply keeping tabs on your equity, these are the numbers that matter right now.
As a licensed REALTOR® with RE/MAX ONE serving Ventura County, I pull this data straight from the MLS every month so you get the ground truth. Additionally, I break down what it means for your specific situation — because a countywide median is a starting point, not an answer. Let’s dig in.
Ventura County Real Estate Market Update: July 2026 Snapshot
Based on all 553 closed residential sales recorded in July 2026.
The headline median only tells part of the story. While the county remains firmly in high-value territory, the pace has cooled from the breakneck spring market. As a result, buyers have a little more room to breathe, and sellers who price correctly are still getting strong results. For context on how we got here, you can revisit June's Ventura County market update and track the trend line month over month.
Median Home Price Across Ventura County in July 2026
The countywide median of $872,000 reflects a market that has held its value even as transaction volume normalizes. Furthermore, the gap between the median ($872,000) and the average ($1,078,410) confirms what local agents already know: a healthy band of luxury sales in cities like Ojai and Westlake Village pulls the average upward, while the median gives you the truer read on the typical Ventura County home.
Notably, 35% of July's closed sales crossed the $1 million mark. That figure underscores how much the definition of a “mid-range” home has shifted across coastal Southern California. For a deeper historical view, see the full breakdown of median home price across Ventura County by city and year.
Single-Family Homes vs. Condos vs. Townhomes
Because property type drives price and pace, here is how July's sales split out:
Consequently, if affordability is your priority, condos and townhomes remain the entry points into Ventura County — often several hundred thousand dollars below the single-family median. On the other hand, townhomes actually moved fastest of the three types in July, at a median of just 26 days, which tells me demand for lock-and-leave living stayed strong through the summer.
Days on Market and Sale-to-List Price Ratio
Two numbers reveal the true temperature of any market: how long homes sit, and how close they sell to asking. In July, the median days on market in Ventura County was 31, while the median sale-to-list price ratio held at 99.0%.
In other words, this is a balanced market with a slight lean toward buyers. Although well-priced, move-in-ready homes still attract multiple offers and sell fast, overpriced listings are getting corrected by the market. Meanwhile, 39% of sellers offered buyer concessions — with a median credit of about $26,700 — which is a meaningful shift from the no-concession seller's market of a couple of years ago. Similarly, if you are trying to decide whether you should wait to buy in 2026, this concession trend is worth factoring into your math.
Ventura County Home Prices by City: July 2026 Breakdown
Sorted by median price to show where values, pace, and demand differed most across the county.
| City | Sales | Median Price | Median DOM | Sale-to-List | $/SqFt |
|---|---|---|---|---|---|
| Ojai | 13 | $1,590,000 | 32 | 100.0% | $967 |
| Westlake Village | 25 | $1,200,000 | 33 | 96.5% | $666 |
| Thousand Oaks | 61 | $1,040,000 | 33 | 99.0% | $538 |
| Oak Park | 11 | $1,039,500 | 41 | 98.0% | $564 |
| Newbury Park | 45 | $1,039,000 | 35 | 99.0% | $527 |
| Moorpark | 34 | $960,000 | 28 | 99.5% | $459 |
| Camarillo | 77 | $905,000 | 31 | 100.0% | $503 |
| Ventura | 68 | $864,500 | 29 | 100.0% | $548 |
| Simi Valley | 84 | $797,000 | 32 | 100.0% | $469 |
| Oxnard | 71 | $780,000 | 17 | 100.0% | $511 |
| Santa Paula | 18 | $753,195 | 32 | 100.0% | $394 |
| Port Hueneme | 26 | $622,500 | 28 | 99.0% | $472 |
Oxnard posted a 17-day median while holding 100% of asking.
Ojai reached a $1.59M median and $967 per square foot.
Simi Valley and Camarillo closed 84 and 77 sales.
What July's Market Trends Mean for Buyers
For buyers, the July data is encouraging. Because 51% of homes sold below asking and 39% of sellers offered concessions, your negotiating position is stronger than it has been in several years. Additionally, with a median of 31 days on market, you generally have time to see a home, sleep on it, and write a considered offer rather than a panicked one.
That said, the strongest listings still move quickly. Consequently, the winning strategy in this market is to be fully pre-approved and ready to act decisively on the right home, while staying disciplined enough to walk away from anything overpriced. Since concessions are common, don't be shy about asking for a rate buydown or closing-cost credit — many sellers expect it.
Build a Smart Buyer PlanWhat July's Numbers Mean for Sellers
Sellers, there is good news and a caution. The good news: homes that are priced right and shown well are still selling at 99% of list, and in fast cities like Oxnard, in under three weeks. The caution: the days of naming any price and watching offers pour in are over. Because 31% of July sellers had to cut their price, an accurate list price from day one is the single biggest lever you control.
Pricing is where a data-driven agent earns their keep. Therefore, before you list, it is worth getting a precise, comp-based read on your home's value rather than relying on an automated estimate. You can start with a free home valuation and then we can refine it together with real neighborhood comps.
See What Your Home Is WorthLooking Ahead: What to Watch Heading Into August
As we move into late summer, a few trends bear watching. First, mortgage rates continue to steer buyer demand week to week, and any meaningful move will ripple through the fall market quickly. Second, inventory typically softens after Labor Day, which can tighten conditions for buyers who wait too long. Finally, the concession trend is worth tracking — if it deepens, it signals continued buyer leverage; if it fades, the market is firming back up.
For the broader regional picture, the California Association of REALTORS® publishes statewide data that pairs well with this local read. Ultimately, though, real estate is hyperlocal, and the county median is no substitute for a conversation about your street, your price band, and your timeline.
Ventura County Real Estate Market Update: July 2026 FAQ
What is the median home price in Ventura County in July 2026?
The median closed home price in Ventura County for July 2026 was $872,000, based on 553 closed residential sales pulled from the MLS. The average sale price was higher, at $1,078,410, reflecting a strong luxury segment.
How long does it take to sell a home in Ventura County right now?
In July 2026, the median days on market in Ventura County was 31 days. However, pace varied widely by city — Oxnard homes sold in a median of just 17 days, while some higher-priced areas took 40 days or more.
Is Ventura County a buyer's or seller's market in 2026?
July 2026 data points to a balanced market with a slight buyer lean. While the median sale-to-list ratio held at 99%, 51% of homes sold below asking and 39% of sellers offered concessions, giving qualified buyers real negotiating room.
Which Ventura County city is the most affordable in July 2026?
Among cities with meaningful sales volume, Port Hueneme had the lowest median price at $622,500, followed by Santa Paula at $753,195 and Oxnard at $780,000. Condos and townhomes countywide also offer entry points well below the single-family median.
How accurate is this Ventura County real estate market update?
Every figure in this update comes directly from closed-sale MLS data for July 2026 — not automated estimates. That is the difference between a real market read and a website zestimate. For a precise value on your specific home, reach out for a comp-based analysis.
Ready to Make Your Move?
The numbers tell you where the market is; a local expert tells you what to do about it. Whether you are buying, selling, or simply want an honest read on your home's current value, contact Zac Wasserman at RE/MAX ONE — your local Ventura County real estate expert — and let’s talk through your specific situation with real data behind every decision.
- All Posts
- Buyer Guides
- California Home Insurance & Wildfire Risk
- Home Financing (Mortgage & Loan Guides)
- Market Updates & Forecasts
- Seller Guides
- Back
- Ventura County Real Estate Market Updates
- San Fernando Valley Real Estate Market Updates (Monthly): Prices, Inventory & Trends
Ventura County Mortgage Rates October 2026 October 2026 Mortgage Market Update Ventura County Mortgage Rates October 2026: 7.4% and What...
Ventura County Home Seller Guide | Fall / Winter 2026 Should You Sell Now or Wait Until Spring? Ventura County...
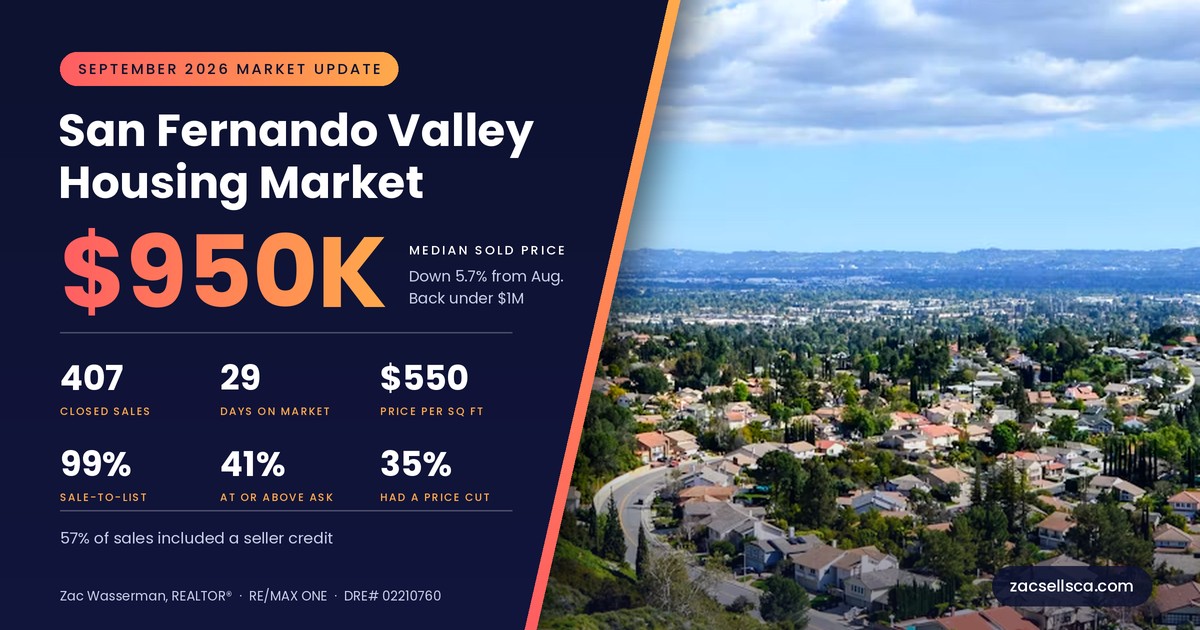
SEPTEMBER 2026 · MARKET UPDATE San Fernando Valley Housing Market Update: September 2026 Prices, Trends & City-by-City Data The median...
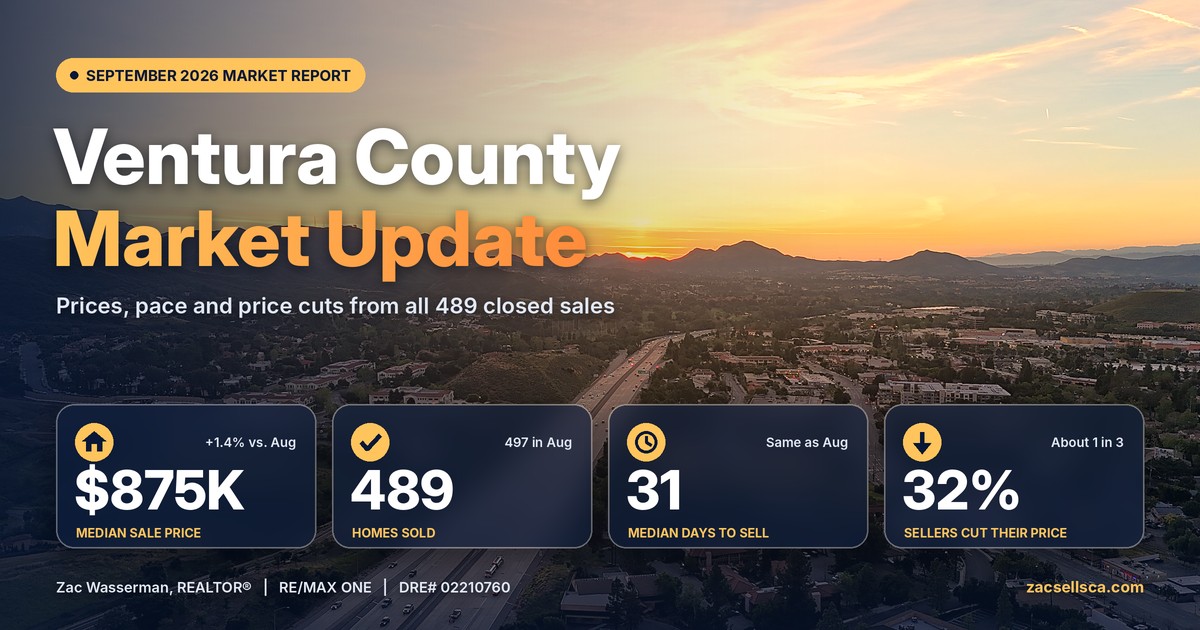
Ventura County’s September 2026 housing market: $875K median price, 489 closed sales, 31 days on market, and city-by-city data for...

State Farm filed to start writing new California home policies again, but only for homes with an IBHS Wildfire Prepared...
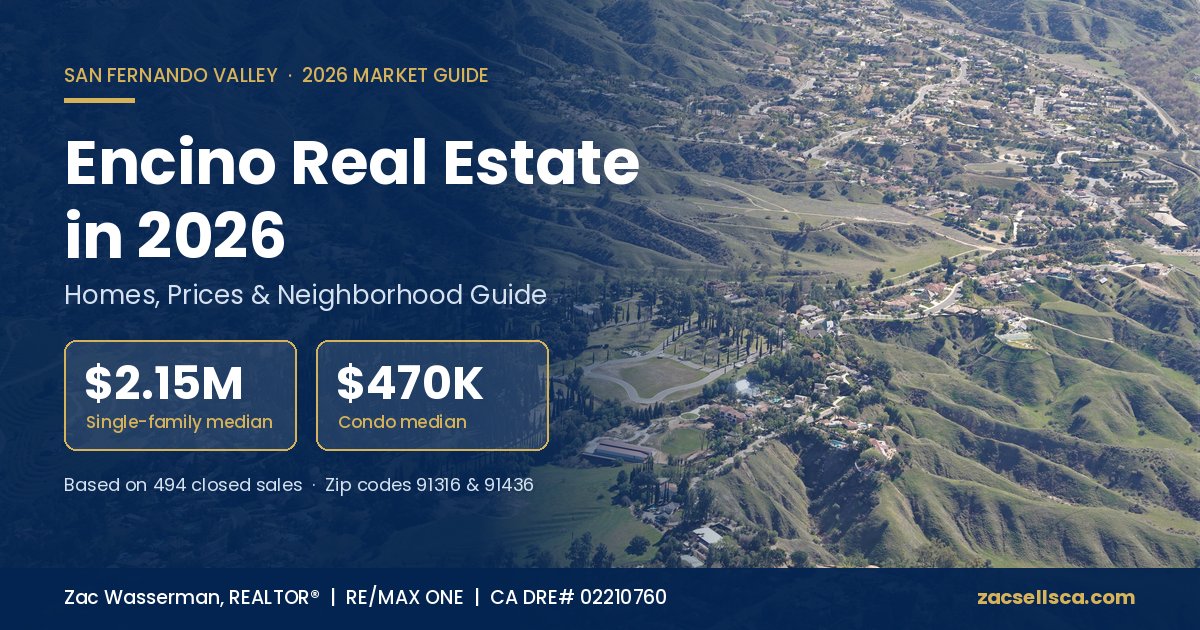
Encino real estate in 2026: see median home and condo prices, 494 closed sales, 91436 vs. 91316 trends, neighborhood insights,...