
Port Hueneme Investment Properties in 2026: NNN, Owner-Financed & Commercial Real Estate
Explore Port Hueneme investment properties in 2026, from multifamily and NNN opportunities to owner-financed and commercial real estate near the port.


Looking for the 2026 Southern California housing market forecast? This guide covers Ventura County and Los Angeles market predictions—mortgage rates, home prices, inventory trends, and practical strategies for buyers and sellers. Understanding Ventura County real estate micro-markets and Los Angeles County real estate micro-markets is essential for success.
What to expect in 2026: most major forecasts point to mortgage rates staying around the low-to-mid 6% range, with modest price growth and a slow-but-steady thaw in activity—more navigable, not a dramatic “boom.”
Multiple 2026 outlooks point to elevated rates versus pre-2022 norms, with gradual easing rather than a cliff-drop.
Forecasts generally call for modest appreciation nationally, with California behaving differently by submarket and supply.
In a steady-rate environment, winning comes down to financing readiness, neighborhood selection, and realistic pricing.
The most consistent theme across major forecasts is this: mortgage rates may ease somewhat, but they’re expected to remain elevated compared to the 2010s and the pandemic-era lows. For buyers preparing to enter the market, understanding how to get pre-approved for a mortgage in 2026 is a critical first step.
Here’s the good news for 2026 homebuyers: after three years of elevated rates, we’re finally seeing meaningful relief. This chart shows the mortgage rate journey from the pandemic lows through today’s market—and the context you need for 2026:
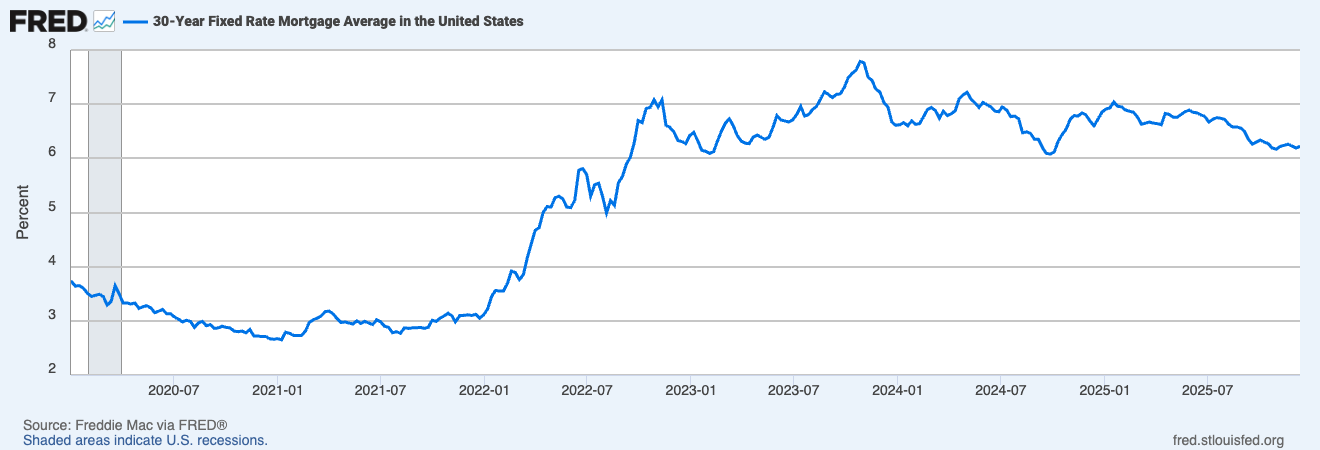
When it comes to the Southern California housing market in 2026, the consensus among analysts leans toward modest appreciation rather than surging growth. The practical takeaway: your neighborhood matters more than the headline. Turnkey homes, strong school boundaries, and low-risk locations can keep pricing power even when the broader market is slower.
While appreciation will be modest compared to 2020–2021, both Ventura County and Los Angeles County show continued growth. Here’s what the data suggests for median home prices through 2026:
Median home price trends & projections for Ventura County and Los Angeles County
Both markets show continued appreciation despite higher rates. Ventura remains more affordable than LA, but both are seeing modest, sustainable growth—not the double-digit spikes of 2020–2021.
2026: $870K–$895K
+1.5% to +4.5%
From 2025’s $857K
2026: $1.02M–$1.06M
+2% to +6%
From 2025’s $1.0M
Before forecasting 2026, it helps to anchor where we are today. The following Ventura County baseline metrics reflect the most recent monthly snapshot available at the time of writing.
| Metric | Ventura County (latest month) | What it means heading into 2026 |
|---|---|---|
| Median sale price | About $857K (latest monthly snapshot) | Pricing power is neighborhood-specific; “median” hides big swings by city and condition. For city-specific insights, explore our guides to Thousand Oaks, Camarillo, and Simi Valley. |
| Days on market | About ~60 days | Buyers have more breathing room than peak frenzy years; sellers must earn attention with price + presentation. |
| Sales volume | Roughly flat-to-up year over year (monthly) | Small improvements are possible if rates stabilize and inventory improves, particularly in “A” school boundaries and turnkey condition. |
Explore city-specific 2026 outlooks: Oxnard, Port Hueneme, Ventura, Ojai, Moorpark, Newbury Park, and Westlake Village.
Data note: Use this as directional context. City-level and neighborhood-level conditions can diverge materially by street, school boundary, home condition, lot size, and micro-location.
The Los Angeles market in 2026 has a different dynamic: stronger price stratification, more investor activity in certain submarkets, and higher sensitivity to affordability. Here’s the latest baseline snapshot at the time of publishing:
| Metric | Los Angeles (latest month) | What it means heading into 2026 |
|---|---|---|
| Median sale price | About ~$1.0M (latest monthly snapshot) | Affordability is the main governor; small rate changes can shift demand, especially for payment-sensitive buyers. |
| Days on market | About ~60 days | Condition and pricing discipline matter—buyers will pass on “almost right.” |
| Market behavior | Highly neighborhood-dependent | Expect “micro-markets”: one ZIP is hot, the next is flat, and the difference is often school + commute + condition. |
For detailed Los Angeles market analysis, see our Los Angeles County real estate guide covering submarkets from the Westside to the Valley.
Properties in Santa Monica, Manhattan Beach, Venice, and Malibu often maintain pricing power despite higher rates. These markets have historically shown resilience during rate volatility due to limited inventory and high-income buyer pools. Expect medians to hold or grow modestly (often 1–3%), with the luxury segment ($3M+) showing more volatility by property type and motivation.
Cities like Camarillo, Oxnard, and Simi Valley offer more affordability entry points for first-time buyers and families. These markets may see 2–4% appreciation as buyers priced out of LA expand their search radius. Watch for increased competition in the $650K–$850K band where monthly payment thresholds cluster.
Homes with wildfire exposure or insurance complexity may face headwinds. Buyers increasingly factor insurance costs into affordability calculations before writing offers. For strategies on navigating these markets, see our LA wildfire insurance guide and Ventura County wildfire insurance guide.
Areas like Pasadena, Burbank, and Glendale that balance LA employment access with strong amenities may remain firm if inventory stays constrained. These markets appeal to buyers seeking strong “daily life” value without coastal premiums. Expect 3–5% appreciation where turn-key supply is limited.
In a world where rates hover around ~6%, buyers win by being more prepared than the competition—not by waiting for a perfect headline. Start by getting pre-approved with competitive lenders so you understand your real buying power and your comfort-zone payment.
Rates may not collapse. Your advantage comes from reducing payment volatility: stronger down payment, lender credits where available, and realistic price targets. If rates do drop later, refinancing becomes an option—but it shouldn’t be your entire plan.
See how different rates and down payments affect your monthly mortgage payment
This calculator shows principal and interest only. Your total monthly payment will also include property taxes, homeowners insurance, and HOA fees if applicable.
For detailed payment planning strategies, download our complete affordability worksheet.
In mixed markets, location premiums usually hold. If you have to compromise, compromise on cosmetics—not the street, school boundary, or long-term desirability. Research Ventura County school districts and neighborhood quality indicators before making offers.
Turnkey homes can still attract competition. Value-add properties can be less crowded—if you budget correctly and do your due diligence. Strong listing presentation can also shape buyer perception; understanding fundamentals like real estate photography helps you separate “staged glow” from actual condition.
In 2026, the best buyers move quickly and protect themselves. Set offer ranges, define non-negotiables (insurance, HOA, condition), and review our offer strategy checklist before you’re in a deadline situation. A tight offer process often beats a slightly higher price because it reduces friction and uncertainty for sellers.
In parts of Southern California, insurance availability and cost can affect affordability and even deal viability. For insurance planning, use our pre-purchase insurance checklist. If you haven’t read them yet, here are two related guides:
If 2026 is “steady” rather than “explosive,” sellers need to lean into fundamentals: price it right, present it right, and market it like it’s competing (because it is).
A buyer at ~6% financing is payment-sensitive. Overpricing can cost you the first 14–21 days, which is typically when your listing gets peak attention. Use our seller resources including a home value estimator as a starting point, then validate with a full comparative market analysis (CMA) and on-market competition.
Small improvements (paint, lighting, curb appeal, staging) can widen your buyer pool—and in a slower market, that is leverage. Consider professional home staging to maximize first impressions and photo-to-showing conversion.
The best concessions are the ones that expand affordability: temporary buydowns, closing cost credits, or repairs that remove deal friction. The goal is to increase the number of qualified buyers who can comfortably say yes—not to “negotiate against yourself.”
In 2026, execution matters. That means strong photos, clean disclosures, showing strategy, and pricing discipline—all aligned in the first week. A well-coordinated launch reduces the chance your listing “goes stale,” which can force price reductions later.
Understanding what shifted between 2025 and 2026 helps explain current market dynamics. For historical context, review our market analysis archives.
After peaking above 7.5% in 2023 and hovering in the high-6% to low-7% range through much of 2024–2025, rates stabilized into the low-to-mid 6% range by late 2025. That stability reduced payment shock and brought more buyers off the sidelines—not a flood, but a steady thaw.
After years of tight supply, more homeowners listed as they adjusted to the reality that 3% rates may not return soon. This created a more balanced environment where buyers have choices and sellers must compete on price and condition.
What used to be a closing-week detail is now a pre-offer consideration in many hillside and high-risk zones. Buyers increasingly request insurance quotes before writing offers, and sellers proactively share policy details to reduce deal friction.
Unlike the 2020–2021 frenzy, 2026 buyers lead with monthly comfort. That creates price ceilings in certain submarkets and forces sellers to align with today’s qualified buyer pool.
Current inventory, pricing trends, and monthly market snapshot.
City guides, neighborhood insights, and local market data.
Down payment programs, rates, and step-by-step strategy.
Coverage options, costs, and buyer strategy for LA County.
FAIR Plan options, costs, and insurability planning.
Calculators, checklists, and planning worksheets.
Most major forecasts expect rates to hover around the low-to-mid 6% range in 2026, with uncertainty by quarter and market conditions. The most practical approach is to plan for a payment that works at today’s rates and stay flexible if refinance opportunities appear later. Key insight: Even if rates drop to 5.5% later in 2026, the payment difference on a $680,000 loan is often only around $200/month—meaningful, but not always worth delaying a purchase if you find the right home. For detailed rate analysis, see our 2026 mortgage pre-approval guide.
Broad forecasts point to modest movement overall. In practice, Ventura County is many micro-markets: some neighborhoods may soften while others hold firm based on schools, commute, condition, and inventory. If you want a precise read for your area, a comp-based snapshot is more reliable than countywide headlines.
For prepared buyers, a steadier market can be an opportunity: less frenzy, more negotiation, and more time to evaluate. Align payment comfort with neighborhood quality, and use tools like affordability planning to stay grounded when inventory is tight. The advantage in 2026: unlike 2021, you’re less likely to face 10–20 competing offers on every listing—giving you time for proper due diligence, repair negotiations, and insurance verification before removing contingencies.
Yes—if you price correctly and present the home well. In a market without runaway demand, execution matters more than ever: photos, condition, pricing discipline, and a strong first-week launch.
Both, but inventory shapes leverage. When buyers have choices, pricing discipline and condition become decisive. When supply is tight, even small rate improvements can increase competition quickly.
Payment planning, down payment options, and insurance diligence. Start with our comprehensive Ventura County first-time homebuyer guide, then narrow to neighborhoods that fit your monthly comfort zone and commute needs. Critical 2026 tip: factor in the full monthly payment (mortgage + taxes + insurance + HOA) from day one. Many first-time buyers in 2025 were surprised by insurance costs—don’t let that derail your offer strategy. Use our payment calculator above to model scenarios before falling in love with a property.
Request a short neighborhood snapshot: current comps, buyer demand, days-on-market trend, and a pricing/offer strategy aligned with your timeline and goals. This is the most reliable way to translate “countywide” trends into your street-level reality.
This 2026 Southern California housing market forecast points to a more balanced, strategic market for both Ventura County and Los Angeles. With mortgage rates stabilizing in the low-6% range and modest price appreciation expected, success in 2026 comes down to preparation over prediction.
Whether you’re buying or selling, fundamentals matter more than ever: accurate pricing, financial readiness, and understanding your local micro-market. The neighborhoods that thrive tend to be those with strong daily-life fundamentals—schools, commute convenience, lower insurance friction, and tight turnkey supply.
Start by exploring Ventura County neighborhoods or reviewing the latest market updates and buyer/seller strategies, then contact me directly for a customized market analysis and strategy session.
Forecast references used in this analysis include: C.A.R. 2026 California Housing Market Forecast, Redfin 2026 housing predictions, Zillow 2026 housing outlook, Realtor.com 2026 forecast reporting, and a Reuters poll on 2026 rates/prices. Local baseline metrics reference the most recent monthly trends available at time of writing. Mortgage rate historical data sourced from Federal Reserve Economic Data (FRED), Federal Reserve Bank of St. Louis.

Explore Port Hueneme investment properties in 2026, from multifamily and NNN opportunities to owner-financed and commercial real estate near the port.

Ventura County Mortgage Rates: September 2026 Update September 2026 Mortgage Update Ventura County Mortgage Rates: September 2026 Update Rates have climbed to a one-year high. Here is where mortgage rates stand, why they moved higher, what the upcoming Fed meeting could mean, and how today’s rates translate into a real Ventura County home payment. If you have been keeping an eye on Ventura County mortgage rates this month, here is the honest headline: rates just climbed to a one-year high, and the relief so many buyers have been waiting for has not arrived. As of mid-September 2026, the average 30-year fixed sits near 6.81%, the 15-year fixed is around 6.13%, and a 5/1 adjustable-rate mortgage is running close to 6.56% APR. Therefore, if you were counting on a friendly rate environment this fall, it is time to plan around the market we actually have rather than the one we keep hoping for. As a local REALTOR® with RE/MAX ONE, I would rather give you the real picture than a comfortable one. Below, I break down exactly where Ventura County mortgage rates stand, why they moved higher, what the September 16 Fed meeting could do, and — most importantly — what all of this means for a real monthly payment on a home here. Ventura County Mortgage Rates Today: September 2026 Snapshot Here is where the numbers land as of mid-September 2026: Mortgage Type Mid-September 2026 Rate 30-year fixed ~6.81% 15-year fixed ~6.13% 5/1 adjustable-rate mortgage (ARM) ~6.56% APR For context, that 30-year figure is a fresh one-year high. Additionally, the 10-year Treasury yield — the benchmark that mortgage rates track most closely — pushed up near 4.95% this week, which is the real engine behind the move. Keep in mind that Ventura County mortgage rates are national rates applied locally; your quoted rate still depends on your credit score, down payment, loan size, and property type. However, the direction of travel is the same for everyone: up, not down. Important: These are average, well-qualified rates. Consequently, the number on your loan estimate could come in higher or lower, which is exactly why shopping multiple lenders matters so much right now. Why Ventura County Mortgage Rates Just Hit a One-Year High Rates did not climb by accident. Instead, two forces pushed them up together. First, the August jobs report came in hot — roughly 162,000 new jobs against much softer expectations, with unemployment holding at about 4.1%. A strong labor market signals a strong economy, and a strong economy tends to keep inflation sticky. As a result, bond investors demanded higher yields, and mortgage rates followed. Second, inflation has stayed stubbornly above the Federal Reserve’s 2% target. Because of that, the market has largely given up on the idea of near-term rate cuts. In other words, the “rates will fall soon” narrative that dominated late 2025 has quietly reversed. Therefore, Ventura County mortgage rates are not sitting at a one-year high because of anything local — they are elevated because the national inflation-and-jobs story turned hawkish. The September 16 Fed Meeting: Hike, Hold & What It Means Locally All eyes are on the Federal Open Market Committee, which announces its next decision on September 16 at 2:00 p.m. Eastern. This meeting is unusual because it is a genuine coin flip. The Fed has held its benchmark rate at 3.50%–3.75% at every meeting this year, and now, for the first time in a while, a rate hike is on the table rather than a cut. To be clear about the odds: prediction markets currently lean toward a 25-basis-point hike, with the remaining probability on no change, and essentially no one is pricing in a cut. Meanwhile, major forecasters are split — some expect a hike, while others expect the Fed to hold steady through the rest of 2026. Since the committee will also release an updated set of economic projections, the “dot plot” that accompanies this decision could move markets as much as the rate call itself. The Fed does not directly set mortgage rates. Although a hike would confirm a hawkish stance and could nudge rates higher, mortgage pricing has already moved in anticipation. Consequently, if the Fed hikes as expected, much of that is baked in; however, if the Fed surprises with a hold and a dovish tone, we could actually see a small pullback in rates. Either way, do not expect a dramatic drop this month. What Today’s Rates Mean for a Ventura County Home Payment This is where national headlines stop being useful and local math takes over. The median home price in Ventura County was about $862,500 as of August 2026, so let me show you what current Ventura County mortgage rates do to a real payment at that price point. Scenario 1: 20% Down With 20% down ($172,500), you are financing $690,000. Loan Rate Principal & Interest 30-year fixed 6.81% about $4,503/month 15-year fixed 6.13% about $5,871/month Scenario 2: 10% Down With 10% down ($86,250), you are financing $776,250. Loan Rate Principal & Interest 30-year fixed 6.81% about $5,066/month Remember, those figures cover principal and interest only. In addition, you will layer on property taxes, homeowners insurance, and — with less than 20% down — mortgage insurance. Because insurance costs have risen sharply across our county, that “everything else” line matters more here than it did a few years ago. If you want to pressure-test your own price point, how much house can I afford in Ventura County walks through the full budget, and you can also run your own numbers on our mortgage calculator. One more local wrinkle: because the county median sits close to the conforming loan ceiling, many Ventura County buyers land in jumbo-loan territory, which can carry different pricing. For that reason, it is worth reviewing the 2026 conforming and jumbo loan limits before you assume which bucket you are in. 30-Year vs. 15-Year vs. ARM in a High-Rate Market When Ventura County mortgage rates are elevated, loan structure becomes a

Can You Sell an ADU Separately in California? Your 2026 AB 1033 Guide for LA & Ventura County Sell an ADU Separately in California (AB 1033) If you built a backyard unit to add income or house family, you have probably wondered whether you can sell an ADU separately from your main home and cash in on that equity. It is one of the most common questions I hear from homeowners across Ventura County and the San Fernando Valley, and the honest 2026 answer has real nuance. A California law called AB 1033 made separate sales possible in theory. However, whether it applies to your property depends entirely on where you live. In this guide, I will walk you through exactly what AB 1033 does, where it stands locally right now, and how to position yourself if your city eventually opts in. I am Zac Wasserman, a licensed REALTOR with RE/MAX ONE, and I help buyers and sellers navigate exactly these kinds of gray areas every week. Let’s clear up the confusion. What AB 1033 Actually Does (and What It Doesn’t) Assembly Bill 1033 was signed into law in October 2023 and took effect on January 1, 2024. In plain terms, it added a new section to California’s planning code that gives cities and counties the authority to let homeowners sell an accessory dwelling unit as its own condominium, separate from the primary house on the same lot. Before this law, an ADU was legally tied to the main home and could not be sold on its own. Here is the catch that trips up most homeowners, though. AB 1033 is permissive, not mandatory. In other words, the state did not automatically unlock separate ADU sales everywhere. Instead, each individual city or county must affirmatively pass its own local ordinance before any homeowner in that jurisdiction can take advantage of the law. As a result, the map of where this actually works is patchy, and it is changing slowly. Additionally, it helps to understand what the law does not do. AB 1033 does not create new types of ADUs, loosen construction rules, or override your local zoning. Furthermore, it does not turn your existing rental unit into an instant sellable asset. It simply changes what can legally happen to a permitted ADU after it is built, and only in places that have opted in. The key distinction California allows local governments to create an AB 1033 program. The law does not automatically give every California homeowner the right to sell an ADU separately. Can You Sell an ADU Separately in California Right Now? For most of the state, the short answer is still no. As of 2026, only a small number of California jurisdictions have adopted the local ordinance required for a separate ADU sale. San Jose led the way and completed the state’s first separate ADU sale in 2025. Santa Monica followed with its own ordinance, and unincorporated San Diego County adopted a program that took effect in April 2026. A few other cities are studying or drafting ordinances, but the list of places where this is fully operational remains short. Consequently, whether this option is even available to you comes down to one question: has your specific city or county opted in? If the answer is no, then under default state law your ADU still cannot be sold apart from the main house, no matter how nice or independent the unit is. This is why I always tell homeowners to confirm their local status before making any decision based on AB 1033. AB 1033 Status in Los Angeles and Ventura County (2026) Now for the part that matters most to my clients. As of 2026, neither Los Angeles nor Ventura County allows the separate sale of an ADU. Let’s break it down by area. Ventura County In Ventura County, the county updated its ADU ordinance in 2024 to align with state law, and it applies to all unincorporated areas through the Resource Management Agency. However, that ordinance does not implement an AB 1033 separate-sale program. Moreover, none of the county’s ten incorporated cities, including Thousand Oaks, Camarillo, Simi Valley, Oxnard, and Ventura, has adopted its own AB 1033 ordinance yet. Therefore, if you own an ADU anywhere in Ventura County today, you cannot sell it separately from your primary residence. Los Angeles The picture is similar in Los Angeles. The City of Los Angeles introduced a council motion back in 2025 to explore AB 1033, but that motion has not advanced into an adopted ordinance. Likewise, unincorporated Los Angeles County has not adopted a separate-sale program, and neighboring cities such as Pasadena, Glendale, and Alhambra remain on the sidelines as well. In short, the entire LA-to-Ventura corridor that I serve is currently a “not yet” zone. That said, local policy can shift quickly, and housing pressure keeps AB 1033 on the agenda. For that reason, it is worth understanding how the process would work so you are ready to move the moment your city acts. Your ADU may not be separately sellable yet — but it can still affect what your property is worth today. If you own a home with an ADU in Ventura County or the San Fernando Valley, I can help you look at the property as a whole and understand how buyers may value the additional living space and income potential. Get a Free Home Valuation Call or Text 805.212.9147 How the ADU Condo Conversion Process Works Selling an ADU separately is not as simple as listing it and finding a buyer. Because the law treats the ADU as a condominium, you essentially convert your single lot into a two-unit condo project. Here is the general path in jurisdictions that allow it. 1 The ADU must be fully permitted and have received its certificate of occupancy. 2 A surveyor and civil engineer prepare the required condominium mapping. 3 A condominium plan is recorded and separate ownership interests are created. 4 CC&Rs are recorded

Conejo Valley Market Update · Fall 2026 Thousand Oaks Real Estate Market Update: Fall 2026 Prices remain firm, inventory is improving, and Thousand Oaks is still a seller’s market — but buyers finally have a little more room to negotiate. $1.04M Median Price 296 Closed Sales 32 Median DOM 99% Sale-to-List 2.8 Months Supply If you have been watching the Thousand Oaks real estate market this year, you already know it has been anything but boring. As we move into fall, prices have held remarkably firm, homes are still selling quickly, and inventory remains tight enough to keep sellers in the driver’s seat. However, the pace has cooled just slightly from the summer peak — and that small shift creates real opportunity for buyers who were sitting on the sidelines. I am Zac Wasserman, a licensed REALTOR® with RE/MAX ONE, and I track these numbers across the Conejo Valley every month. Below is exactly where the Thousand Oaks real estate market stands heading into Fall 2026, based on closed sales from June through early September, so you can make your next move with real data instead of guesswork. Thousand Oaks Real Estate Market at a Glance (Fall 2026) Here is the quick snapshot for the greater Thousand Oaks area, which includes Newbury Park: Median Sale Price $1,040,000 Homes Sold · Jun–Early Sep 296 Median Days on Market 32 Days Sale-to-List Ratio 99% Median Price / Sq. Ft. $533 Active Inventory 266 Homes Months of Supply 2.8 Months Fall 2026 Takeaway Therefore, the headline is simple: this remains a seller’s market, but a more balanced one than we saw in spring. As a result, well-prepared buyers finally have a little more room to negotiate. Thousand Oaks Median Home Price: What Homes Actually Sold For The median home price in the Thousand Oaks area was about $1,040,000 in Fall 2026. Within the city of Thousand Oaks specifically, the median closed price landed at $1,045,000 across 191 sales, while neighboring Newbury Park came in at $1,039,000. Additionally, it helps to see how that median moved through the season: Month Median Sale Price June 2026 $1,062,500 July 2026 $1,039,500 August 2026 $1,023,500 In other words, prices eased about 3.7% from the June high into late summer. This is a normal seasonal cooldown rather than a sign of a downturn, since sale-to-list ratios stayed pinned near 99% the entire time. Because sellers kept getting nearly full price, the softening reflects a shift in the mix of homes selling, not collapsing demand. For a wider view of how this fits the county, see the current Ventura County housing market 2026 breakdown. How Fast Are Homes Selling? Days on Market & Sale-to-List 32 Days Market-wide median 28 Days August median 99% Median sale-to-list ratio Speed tells you as much as price. In the Thousand Oaks real estate market, the median home sold in just 32 days, and homes actually moved faster as summer ended — the August median dipped to 28 days. Furthermore, the sale-to-list ratio held at 99% across the market, and in Newbury Park sellers achieved 100% of asking at the median. For example, a home priced correctly and shown well is still selling in about a month, near full price. However, overpriced listings are the ones lingering — a reminder that even in a seller’s market, strategy beats optimism. This is exactly the gap I covered in our look at why homes sometimes sit even when demand is strong. Inventory & Months of Supply: Is It Still a Seller’s Market? Active Listings 266 Monthly Sales Pace ~94 Months of Supply 2.8 With 266 active listings and a sales pace of roughly 94 homes per month, the Thousand Oaks area is carrying about 2.8 months of supply. Generally, anything under three months signals a seller’s market, so Thousand Oaks still qualifies — though it is inching toward balance. Consequently, sellers retain the advantage on pricing and terms, while buyers get slightly more selection than they did in the frantic spring market. This is a healthier setup for everyone. Sellers still win, but buyers are no longer forced to waive every contingency to compete. Prices by Home Type: Single-Family, Townhome & Condo Not every buyer is shopping for the same thing, so here is how the median sale price broke down by property type across the Thousand Oaks area: Property Type Median Price Sales Single-Family Homes $1,120,000 239 Townhomes $735,000 29 Condominiums $568,000 27 As a result, buyers who feel priced out of detached homes still have genuine entry points under $600,000 through condos, and mid-$700,000s through townhomes. Similarly, first-time buyers relocating from pricier parts of Los Angeles often find the Conejo Valley’s condo and townhome inventory a comfortable landing spot. If you are weighing which community fits your budget, our guide to the best neighborhoods in Ventura County is a helpful next read. How Thousand Oaks Compares to Nearby Cities Context matters, so here is where Thousand Oaks sits relative to its Conejo Valley neighbors this fall: Community Median Price Median DOM Thousand Oaks $1,045,000 32 days Newbury Park $1,039,000 31 days Agoura Hills $1,327,250 29 days Westlake Village $1,407,000 35 days Thousand Oaks and Newbury Park offer the most attainable pricing in the immediate area, while Westlake Village and Agoura Hills command a clear premium. However, all four markets are moving at a similar tempo — under 35 days at the median — which tells you demand is strong across the entire Conejo Valley, not just one pocket. For Thousand Oaks Sellers What the Thousand Oaks Real Estate Market Means for Sellers If you are thinking about selling, the numbers are on your side, but the window rewards preparation. Because the median sale price is holding near $1,040,000 and homes are closing at 99% of list, a correctly priced, well-presented home should sell quickly and near full value. However, the slight seasonal softening means the days of naming any price and getting it are behind us. Therefore, pricing to the current comparables —
August 2026 • Local Market Report San Fernando Valley Housing Market Update: August 2026 Prices, Trends & City-by-City Data By Zac Wasserman, REALTOR®RE/MAX ONE • CA DRE# 02210760 Get My Free Home Valuation Plan My Next Move If you have been watching the San Fernando Valley housing market this summer, August delivered a clear message: prices are holding firm, well-priced homes are still moving quickly, and buyers finally have a touch more room to negotiate. As a licensed REALTOR® with RE/MAX ONE who works these neighborhoods every week, I pulled the closed-sale data for every San Fernando Valley community and broke it down so you can see exactly where the market stands heading into fall. Across the Valley, 446 homes closed escrow in August 2026. The numbers tell a story of a market that has settled into a steadier, more balanced rhythm than the frenzy of a few years ago — yet remains firmly a seller’s market in most price ranges. Let’s dig into what actually happened, city by city, and what it means whether you plan to buy, sell, or simply keep an eye on your home’s value. The San Fernando Valley Housing Market at a Glance: August 2026 Here is the high-level snapshot for all closed residential sales across the Valley last month: Median sold price (all homes): $1,007,500 Median price per square foot: $588 Median days on market: 28 Median sale-to-list ratio: roughly 99% Homes sold at or above asking: about 44% Total closed sales: 446 Therefore, the headline number is that the typical San Fernando Valley home is still closing right around the seven-figure mark. However, the more interesting signal sits just beneath it. Homes are selling at about 99% of their final list price, and only around 44% closed at or above asking — a meaningful shift from the days when nearly everything sold over list with multiple offers. Additionally, sellers gave up a little ground from their original asking price, with the typical home closing near 98% of where it first launched. As a result, pricing precision matters more now than it has in years. Meanwhile, mortgage rates stayed in the mid-6% range through August. According to Freddie Mac’s Primary Mortgage Market Survey, the 30-year fixed averaged 6.71% in early September — modestly higher than a year ago, but stable enough that buyers have adjusted their expectations rather than stepping away entirely. San Fernando Valley Median Home Prices in August 2026 The median home price is simply the midpoint — half of all homes sold for more, and half for less — which makes it a far more reliable gauge of the local market than the average, because a handful of multimillion-dollar estates can drag an average sky-high. In August, that Valley-wide median landed at $1,007,500. However, “the Valley” is really a patchwork of very different markets. Consequently, breaking the data down by property type reveals how wide the range truly is: Single-family homes: median $1,182,500 (median $609/sq ft, 27 days on market) Condominiums: median $495,000 (median $446/sq ft, 32 days on market) Townhomes: median $610,000 (median $367/sq ft, 31 days on market) In other words, a detached house in the Valley now runs nearly $1.2 million at the midpoint, while a condo remains one of the region’s most attainable footholds at under half a million. For buyers priced out of a single-family home, that spread is exactly why condos and townhomes keep drawing first-time and move-down buyers. Furthermore, for anyone weighing whether to stretch for a house, it helps to know precisely how much house can I afford in Los Angeles before touring anything. How Fast Are Homes Selling? Days on Market & Sale-to-List Speed tells you as much about a market as price does. In August, the median San Fernando Valley home went from active to pending in 28 days. Moreover, the pace was even quicker for sharply priced listings: roughly one-third of all homes sold within 14 days, and more than half were in escrow inside a month. That said, the market is no longer indiscriminate. Because buyers are more rate-conscious and more selective, the homes that linger tend to share a common thread — they launched above what the data supported. When a listing is priced correctly from day one, it still commands strong attention and frequently multiple offers. When it is not, it sits, and the eventual sale lands below the original ask. This is the single most important dynamic in today’s San Fernando Valley housing market: precision beats optimism. The sale-to-list ratio reinforces the point. At a median near 99%, sellers are still capturing almost all of their asking price. Nevertheless, the fact that fewer than half of homes closed over asking signals that the bidding-war reflex has cooled. For sellers, that makes an accurate, current valuation essential — and if you are curious what your own home would fetch in this market, you can start with a free home valuation. San Fernando Valley Home Prices by City This is where the Valley’s true character shows up. The following table breaks down median sold prices by city for August 2026, covering every community with a meaningful number of closed sales. As you will see, the Valley’s housing market spans well over a million dollars in range from its most affordable neighborhoods to its priciest enclaves. On smaller screens, scroll horizontally to see every column. August 2026 • Closed Residential Sales by City City Median Sold Price Median $/Sq Ft Median Days on Market Sale-to-List Encino $2,050,000 $699 36 99% Calabasas $1,911,500 $711 49 99% Studio City $1,900,500 $822 41 97% Sherman Oaks $1,427,500 $675 25 98% Tarzana $1,325,000 $604 37 98% Woodland Hills $1,215,500 $590 25 97% Northridge $1,100,000 $643 31 100% West Hills $1,040,000 $408 15 96% Chatsworth $905,000 $533 18 91% North Hollywood $850,000 $588 27 100% Winnetka $805,000 $484 24 100% Van Nuys $780,000 $485 36 100% Reseda $763,000 $410 28 100% Panorama City $717,500 $511 22 103% Canoga Park $560,000 $575 25 100%

Ventura County Real Estate Market Update: August 2026 Ventura County Market Update — August 2026 Ventura County Real Estate Market Update: August 2026 If you have been watching home prices in our area and wondering where things actually stand, this Ventura County real estate market update for August 2026 gives you the real numbers. I pulled every closed sale across the county for the month—497 in total—and broke them down by price, days on market, and city. As a licensed REALTOR® with RE/MAX ONE, my goal here is simple: give you an honest, data-first read so you can make a confident decision, whether you are buying, selling, or simply keeping an eye on your equity. The short version? Ventura County remains a firm, well-balanced market. Prices are holding, well-priced homes are still moving quickly, and sellers are collecting very close to their asking price. However, the pace varies a lot depending on your city and price point, and that nuance is exactly where opportunity lives. Throughout this report, I will translate the raw data into what it practically means for your next move. Get My Free Home Valuation Call Zac: 805-212-9147 Ventura County Real Estate Market Update at a Glance (August 2026) Let’s start with the headline figures. Across all 497 closed sales in August, the median sale price landed at $862,500. The average sale price was noticeably higher at roughly $1.1 million, but that gap tells a story: a handful of luxury closings—including a $6.67 million Somis estate and a $6.24 million Thousand Oaks property—pull the average upward. As a result, the median is the more reliable number for most buyers and sellers, because it reflects the typical home rather than the outliers. Here are the county-wide vitals for the month: Median Sale Price $862,500 All property types Single-Family Median $959,500 Detached homes Median Days on Market 31 Days Countywide Sale-to-List Ratio 99% Typical sale Price Per Sq. Ft. $511 Countywide median At / Above Asking 43% Of August sales Cash Purchases ~10% Roughly 1 in 10 sales Additionally, single-family homes made up the bulk of activity, with 374 of the 497 closings. Condominiums accounted for 71 sales and townhomes another 46, so buyers seeking lower price points still had meaningful attached-home inventory to choose from. In short, this was a broad, active month rather than a market propped up by one narrow segment. For Ventura County Homeowners What do these August numbers mean for your home? Countywide statistics are useful, but your neighborhood, condition, lot, upgrades, and exact price range determine what buyers are likely to pay. Get a local value range based on today’s market. Request a Free Home Valuation Median Home Prices Across Ventura County At a $862,500 countywide median, Ventura County continues to sit in a healthy, move-up-friendly range. Furthermore, the spread of sales shows a market with real depth at every level. In August, 31 homes closed under $500,000, while 121 sold between $500,000 and $750,000. The largest slice—164 sales—fell in the $750,000 to $1 million band, followed by 112 sales between $1 million and $1.5 million. Finally, 69 homes traded above $1.5 million, including 39 above the $2 million mark. August Sales by Price Range 31 Under $500K 121 $500K–$750K 164 $750K–$1M 112 $1M–$1.5M 69 Above $1.5M Because inventory is spread so evenly across price tiers, this is not a market that only serves one type of buyer. First-time buyers, move-up families, and luxury purchasers all found homes that closed in August. The countywide median of $511 per square foot is another useful anchor, though it varies widely by city—from the mid-$300s in Santa Paula to roughly $675 in Westlake Village. If you are trying to gauge your own buying power against these prices, my guide on how much house can I afford in Ventura County walks through the math step by step. How Fast Are Homes Selling? Days on Market in August 2026 31 Median days on market 29% Closed in 2 weeks or less Speed is one of the clearest signals of market health, and here the data is encouraging for sellers. The median home spent just 31 days on market before going under contract. Even better, 29% of all August sales closed in two weeks or less, which tells you that sharply priced, well-presented homes are still commanding urgency. However, the average days on market—about 46—ran higher than the median. Consequently, this reveals a two-speed market: turnkey, correctly priced homes fly, while overpriced or dated listings sit and eventually negotiate. In other words, presentation and pricing strategy matter more than ever. Therefore, if you are preparing to list, the pre-market prep work is where deals are won or lost. A home that launches clean, staged, and priced to the comparables can still generate the kind of early urgency that leads to a strong offer. Are Homes Selling Over Asking? Sale-to-List Trends The county’s median sale-to-list ratio held at a strong 99% in August, meaning the typical seller collected 99 cents on every dollar of their asking price. Moreover, 43% of homes closed at or above their list price, and 17% sold for more than asking outright. That is a clear sign that competitive, in-demand properties are still drawing multiple offers. 99% Median sale-to-list ratio 43% Closed at or above asking 17% Sold above asking On the other hand, 43% of sales closed below asking, which underscores the same lesson from the days-on-market data. When a home is priced ahead of the market, buyers push back. Since roughly one in ten buyers paid cash, sellers who prepare well and price to the comps are the ones capturing top dollar. This balance—firm but not frenzied—is what makes the current market feel so stable compared to the extremes of recent years. Ventura County Real Estate Market Update by City County averages are useful, but real estate is hyper-local, so here is how each major city performed in August. The list below covers every city with at least eight closed sales for the