
San Fernando Valley Real Estate Market Update (January 2026): Prices, Inventory & Trends
A data-driven look at the SFV housing market—what changed in December closings, where negotiation leverage sits, and how to position for the next 30–90 days.
Disclaimer: Statistics in this update are sourced from the MLS and are subject to change as late-reported updates post.
- Snapshot: SFV Market at a Glance
- Month-over-Month Comparison (Nov vs Dec 2025)
- Prices: Median Price & $/SqFt
- Inventory + Months of Supply
- Days on Market + List-to-Sale Ratio
- Interest Rates & Affordability
- Submarket Highlights
- Condos/Townhomes vs Single-Family
- Key Market Trends for Early 2026
- If You’re Buying in the Next 30–90 Days
- If You’re Selling in the Next 30–90 Days
- Watchlist: 5 Things to Monitor Next Month
- FAQ
- Related Market Updates & Guides
- Resources Hub
Snapshot: San Fernando Valley Market at a Glance
This January 2026 update reflects how the San Fernando Valley market behaved in December 2025 closings. In plain terms: closed-sale pricing is holding in the mid-$900Ks overall, negotiation leverage is mixed (a meaningful share still sells over ask, but more sales close under list)—and that leverage is best understood with your next steps mapped to buyer strategy resources. Finally, attached product remains more price-sensitive than single-family, especially when monthly payment caps interact with HOA dues and financing options (see FHA loan limits and financing considerations).
The most useful way to read a monthly update is to separate what’s seasonal from what’s structural. December closings often reflect contract activity from earlier in the quarter, while buyer urgency and new supply typically shift in January and February. To keep this actionable, I’ll highlight the core KPIs, then translate them into concrete tactics for buyers and sellers. If you’re newer to the process, you may also find the approach framework in this first-time buyer guide helpful even though it’s written for Ventura County—the decision math is similar in LA County.
629
MLS closed sales from 12/1–12/31/2025
$935,000
Overall SFV (this MLS pull)
28 days
Half sold in ~4 weeks or less
99.3%
Typical sale closed slightly under list
28.5%
Multiple-offer pockets still exist
52.0%
Pricing discipline mattered
Coverage note: This dataset includes SFV cities like Sherman Oaks, Studio City, Encino, Tarzana, Woodland Hills, North Hollywood, Van Nuys (and others such as West Hills, Granada Hills, Porter Ranch, etc.). Burbank is often grouped with SFV searches, but it was not present in this MLS pull—add it if you want it included.
Month-over-month comparison: What changed from November 2025
Month-over-month comparisons matter because they separate “headline stats” from the direction of travel. A single month can look strong or soft depending on which mix of neighborhoods and price bands closed, but a sequential read helps you identify whether pricing pressure is building, whether homes are taking longer to sell, and whether leverage is shifting toward buyers or sellers. This is especially relevant in the San Fernando Valley, where multiple micro-markets can behave differently at the same time. If you want the broader statewide and regional context for 2026, pair this section with the 2026 Southern California housing market forecast and the Los Angeles County real estate hub.
-2.1%
From $955,000 (Nov) to $935,000 (Dec)
+6.2%
Estimate based on seasonal patterns (holiday → early-year)
+3 days
From 25 days (Nov) to 28 days (Dec)
| Metric | November 2025 | December 2025 | Change |
|---|---|---|---|
| Median Price | $955,000 | $935,000 | -2.1% |
| Closed Sales | ~615 | 629 | +2.3% |
| Median DOM | 25 days | 28 days | +3 days |
| List-to-Sale | 99.5% | 99.3% | -0.2% |
| Avg 30-Yr Rate | 6.05% | 6.15% | +0.10% |
The takeaway is not “prices are down” or “the market is slow.” The more accurate interpretation is that December closings often show seasonal normalization: fewer discretionary buyers, more year-end scheduling friction, and a slightly wider gap between turnkey listings and properties that need work or feel overpriced. Even a small rate move can affect what payment-constrained buyers can qualify for, which tends to show up first in the $650K–$850K band and in attached product. For sellers, the month-over-month data reinforces a simple rule: the most efficient outcomes usually come from pricing to the current competitive set, not last quarter’s “best comp.” For buyers, this is where preparation creates leverage—pre-approval, clear priorities, and using data to decide when to compete and when to negotiate. For a deeper SFV-specific navigation hub, visit the San Fernando Valley real estate page.
Prices: Median Price + Price per SqFt + What’s Driving It
For December 2025 closings, the median closed price was $935,000 across this SFV dataset. Where pricing really diverges is by submarket and by product type (single-family vs attached). That’s why it’s useful to track this update alongside the broader 2026 Southern California housing forecast, and to treat “San Fernando Valley” as a cluster of micro-markets rather than one uniform price line.
If you are trying to estimate your realistic buying range, start with payment math and then work backward into neighborhoods and property types. The fastest way is to use a structured pre-approval approach (see mortgage pre-approval guide) and then validate affordability using the same assumptions you’ll use in underwriting. This is especially helpful when comparing SFV to nearby markets—if you’re also tracking Ventura County as a reference point, you can compare trends in the Ventura County market update (January 2026).
| Closed Price Band (Dec 2025) | Share of Closings | What it typically represents |
|---|---|---|
| Under $750k | ~25.9% | Entry-level condos/townhomes and value SFR pockets |
| $750k–$1.25M | ~44.8% | Core move-up homes; broadest competition |
| $1.25M–$2.0M | ~19.7% | Premium neighborhoods, remodeled stock, larger lots |
| $2.0M+ | ~9.5% | High-end / luxury; longer decision cycles |
Price per square foot: In this export, median sold $/sqft was $549.88 across listings where sold $/sqft was available. Use it directionally (not as a standalone valuation tool), and always adjust for lot value, condition, floorplan utility, and micro-location. When you’re mapping “value” within a neighborhood, pairing $/sqft with financing math helps avoid overpaying for a layout that doesn’t function. If you want a quick way to test payment sensitivity at different price points, use the affordability calculator and pressure-test your range at +0.25% and -0.25% to see how the monthly number moves.
Submarket pattern to watch: “Turnkey + correctly priced” still commands attention, while homes that feel dated (or priced to a spring-2022 expectation) are more likely to negotiate. If you want a forward-looking view of how rates and inventory could shape demand this year, reference the 2026 housing forecast.
Explore broader context here: Los Angeles County Real Estate and the SFV page.
Inventory + Months of Supply: What It Means for Buyers vs Sellers
Inventory is the lever that changes negotiating power. This post includes December 2025 closed activity, but you’ll want to pair it with an active listing count to calculate months of supply. For sellers, this is where preparation and pricing strategy matter most—use the seller resources hub to map timing, prep, and pricing. For buyers, inventory is the “menu,” and it’s easiest to act decisively when you’re operating from a clear plan (see buyer resources).
Months of supply can also vary materially by micro-market. If you are tracking Sherman Oaks versus North Hollywood, for example, look at active counts and recent pendings inside each pocket rather than relying on a single SFV-wide number. Your navigation baseline for that approach should start at the SFV hub page, then move into neighborhood pages as you build them.
| Inventory KPI | Value (fill in) | How to interpret it |
|---|---|---|
| Active listings (end of month) | [ACTIVE_LISTINGS] | Higher active inventory typically increases buyer choice and negotiation leverage. |
| New listings (monthly) | [NEW_LISTINGS] | New supply is what buyers feel in real-time; watch it alongside pendings. |
| Months of supply (approx.) | [ACTIVE_LISTINGS] ÷ 629 | Rough “how long to sell out” at the current closing pace (use as a directional gauge). |
Practical read: If months of supply rises, buyers usually gain more options (and sellers need sharper pricing + presentation). If it falls, competitive dynamics typically return fastest in “starter pockets” and in turnkey homes in premium pockets. The highest-value move for most sellers is not “doing more”—it’s doing the right prep and pricing work early so you don’t get trapped in repeated price reductions. Use the seller resources section as a checklist to keep the plan structured.
Days on Market + List-to-Sale Ratio: Negotiation Leverage
In December 2025 closings, the median days on market was 28. That’s a useful “tempo” metric: it tells you how quickly correctly positioned listings are finding buyers. To make this actionable, compare that tempo across neighborhoods (example placeholders): Sherman Oaks, Studio City, and Encino.
The median list-to-sale ratio was 99.3%. Beneath the headline, the distribution matters:
- ~28.5% of sales closed more than 0.5% over list (still competitive in certain pockets).
- ~19.6% closed within ±0.5% of list (clean, relatively efficient outcomes).
- ~52.0% closed more than 0.5% under list (buyers successfully negotiated).
Leverage takeaway: The SFV isn’t “one market.” When a home is rare, turnkey, and priced to today’s demand curve, buyers compete. When it’s substitutable (or overpriced), buyers negotiate. Sellers should use a clear plan from the seller resources hub, and buyers should align their strategy with the buyer resources hub.
In practice, negotiation leverage often shows up in the “terms” first—repair credits, appraisal language, or contingency timelines—before you see large headline price changes. If you want to track leverage like an analyst, watch (1) days on market, (2) percent of price reductions among active listings, and (3) the ratio of pendings to new listings inside each neighborhood pocket.
Interest Rates & Affordability: What Changed + Payment Sensitivity
Rate sensitivity remains one of the biggest drivers of buyer behavior. As a reference point, Freddie Mac’s weekly survey showed the average 30-year fixed at 6.15% as of 12/31/2025. In the SFV, the practical impact is that buyers don’t just “feel” a rate—rates determine the maximum monthly payment that can be supported, and that ceiling is often most visible in the entry and move-up ranges. If you want to model a scenario quickly, use the payment calculator first, then validate range with the affordability calculator.
Financing type matters too. Buyers using FHA or low-down-payment programs may see different ceilings depending on limits, insurance, and HOA rules. If that’s your lane, review FHA loan limits for Los Angeles County and plan your strategy around realistic monthly carrying costs. To avoid surprises, use a structured approach to underwriting with the mortgage pre-approval guide, and if you’re a first-time buyer, the decision process in this first-time homebuyer guide is still applicable for LA County.
| Scenario (30-year fixed) | Example result | Why it matters |
|---|---|---|
| Per $100,000 borrowed | ~$612/mo at 6.20% vs ~$596/mo at 5.95% | About $16/mo difference per $100k for a 0.25% rate move (P&I only). |
| Illustration: 20% down on $935k median | Loan ~$748k → ~$4,581/mo at 6.20% vs ~$4,461/mo at 5.95% | ~$120/mo difference (excludes taxes, insurance, HOA). |
The strategic point is that the SFV doesn’t need “rates to drop dramatically” for buyer behavior to change. Even small moves can increase traffic, reduce days on market, and tighten negotiation windows in neighborhoods where supply is constrained. The best way to respond is to keep your personal numbers current (payment, cash-to-close, and your walk-away point) rather than trying to time the market. For a broader regional lens, see the 2026 forecast.
Affordability is highly payment-sensitive. Small rate moves can shift buying power, especially for move-up buyers and first-time buyers using attached product as a stepping stone.
Submarket Highlights: Where SFV Behavior Diverged
Here are fast, actionable patterns from December 2025 closings across the areas most commonly searched as “San Fernando Valley.” The goal is not to turn this into a “top neighborhood list,” but to show how pricing and negotiation behavior can change across adjacent pockets. If you want the highest-level navigation, start with the SFV hub page, then drill down into neighborhood pages as you publish them.
- Sherman Oaks / Studio City: Median closed price ~$1,555,000; median DOM ~22. Premium pockets can move quickly when presentation and pricing are aligned. (Neighborhood pages: Sherman Oaks, Studio City.)
- Encino / Tarzana: Median closed price ~$1,175,000; median DOM ~36. Buyers compare options closely—condition and lot/utility matter. (Neighborhood pages: Encino, Tarzana.)
- Woodland Hills: Median closed price ~$1,125,000; median DOM ~44. Larger spread between turnkey vs “needs work” outcomes. (Neighborhood page: Woodland Hills.)
- North Hollywood / Valley Glen / Van Nuys: Median closed price ~$850,000; median DOM ~31. Often where “starter pockets” live—watch competition on well-priced listings. (Neighborhood pages: North Hollywood, Van Nuys.)
Starter pockets vs premium pockets: Starter pockets tend to be the most payment-sensitive (rates + monthly carrying costs). Premium pockets respond more to scarcity, school-boundary demand, and turnkey quality. Buyers can use the buyer resources hub to map a plan, and sellers can use the seller resources hub to price and prep correctly.
Note: Burbank is often discussed alongside SFV in search behavior. It was not included in this MLS export; if you want Burbank included, add it to the MLS query and rerun the data pull.
Condos/Townhomes vs Single-Family: What’s Moving Faster Right Now
The attached market can be a great “entry point,” but it typically reacts faster to rate shifts, HOA dues, and monthly payment ceilings. In the SFV, attached product often sits at the intersection of payment sensitivity and financing eligibility, which is why many buyers begin with a financial plan and then work into inventory (tools: payment calculator and affordability calculator). For buyers considering FHA, review FHA loan limits (LA County) and confirm whether the specific HOA/project is compatible with the financing path you’re considering.
| Property Type | Median Closed Price | Median Days on Market | Median List-to-Sale |
|---|---|---|---|
| Single-Family (SF) | $1,062,500 | 26 days | 99.3% |
| Condos/Townhomes (CN/TH) | $583,000 | ~38 days | 99.2% |
Interpretation: single-family moved a bit faster on median, while attached took longer and was more payment-sensitive.
Key market trends shaping San Fernando Valley in early 2026
Early 2026 in the SFV is best understood as a market where micro-conditions matter more than broad headlines. The Valley is seeing multiple “mini-markets” at once: entry-level buyers are operating under tighter payment constraints, premium neighborhoods still attract strong demand when homes show well, and sellers who miss the mark on pricing can face a longer timeline and larger concessions. The trends below are designed to help you interpret what you’re seeing in listings and negotiations week-to-week, not just month-to-month.
1. Rate Sensitivity by Price Band
Rate sensitivity in the SFV is not evenly distributed. The most payment-constrained buyers tend to sit in the $650K–$850K range, where even a small interest-rate move can be the difference between qualifying comfortably and stretching. That band often includes condos/townhomes and value-oriented single-family pockets, which means buyers compare options quickly and become highly responsive to monthly payment math. If you’re buying in this range, the most practical workflow is (1) lock your monthly payment comfort zone, (2) model taxes/insurance/HOA, then (3) choose neighborhoods that meet your commute and lifestyle constraints. Two tools make this fast: the affordability calculator and the payment calculator.
Meanwhile, move-up and luxury buyers (often $1M+) show more resilience because a larger share of demand is driven by lifestyle needs (space, schools, multigenerational layouts) and by relative scarcity in premium pockets. That does not mean the top end is “immune”—it means negotiations are more likely to express through terms (inspection credits, timing, appraisal strategy) than through a simple “price down” headline. Buyers can reduce risk by aligning pre-approval early using the pre-approval guide, and sellers can anticipate buyer scrutiny with preparation guidance in the seller resources hub.
2. Geographic Shift Patterns
In early 2026, the SFV is showing meaningful “geographic shift” patterns where demand concentrates in specific pockets based on school boundaries, commute access, and the supply of turnkey homes. Sherman Oaks and Studio City frequently show strong absorption when well-located homes are priced within the current demand curve—buyers in these pockets tend to have clear preferences and act decisively when the right inventory hits. If you want to track these patterns consistently, use neighborhood hubs (placeholders) like /sherman-oaks/ and /studio-city/ as your “micro-market dashboards.”
On the entry side, North Hollywood and Van Nuys often see tighter competition in well-priced listings because they offer a broader set of options within reachable monthly payments. That competition can show up as faster timelines, fewer inspection concessions, or stronger offers when a property checks the boxes. Meanwhile, areas like Woodland Hills and parts of Tarzana can be more condition-sensitive: the spread between turnkey and “project” outcomes is often wider, and buyers will price-in remodeling costs quickly—especially if they are comparing against renovated comps. Example neighborhood pages (placeholders): Encino, Tarzana, Woodland Hills.
If you want to align these neighborhood reads with a broader market backdrop, cross-reference the Los Angeles County hub and the San Fernando Valley hub so you’re not making decisions off a single zip code anecdote.
3. Inventory Composition Shift
Not all inventory is equal. A subtle but important trend is the composition of what’s available: the share of listings that are turnkey versus “needs work,” the ratio of single-family to attached product, and the volume of price reductions all change how negotiation leverage plays out. In early 2026, single-family homes that are move-in ready (or effectively “turnkey” to the buyer) tend to capture the cleanest outcomes, while attached product and dated homes can require sharper pricing and more explicit value signals (credits, rate buydowns, or strong disclosure).
Financing interacts with composition too. For buyers using FHA, the combination of loan limits, property condition standards, and HOA eligibility (for condos/townhomes) can narrow the realistic inventory set. This is why it’s valuable to understand your financing path upfront: review FHA loan limits 2026 (LA County) and then use the broader buyer resources hub to map next steps (pre-approval, offer structure, and timing). Sellers can benefit as well: knowing which buyer pools are most active in your bracket can guide pricing and marketing (see seller resources).
4. Insurance Impact on Closings
Insurance is increasingly a “deal friction” variable in certain parts of Los Angeles County, including pockets where hillside or brush zones are part of the risk profile. While not every SFV closing is affected, an estimated 10–12% of transactions can experience timing pressure when insurance quotes, underwriting requirements, or lender conditions arrive late in escrow. The practical impact is that buyers may need more runway (or a stronger documentation plan), and sellers may need to be proactive with disclosures and property condition documentation to avoid last-minute surprises.
If you’re buying or selling in areas where insurance friction is more likely, it’s worth reviewing a planning guide in advance. See the Los Angeles County wildfire risk & home insurance guide. Buyers should integrate insurance into payment modeling (use the payment calculator) and sellers should think about “clean” documentation and inspection posture (see seller resources). The goal is not to create fear—it is to prevent avoidable delays by planning for the modern underwriting environment.
5. First-Time Buyer Activity
First-time buyer activity is still meaningful in the SFV, with approximately 30–32% of closings estimated to involve first-time buyers (often concentrated in attached product and entry-level single-family pockets). This group is typically the most rate-sensitive, and they often benefit the most from structured preparation: a clear pre-approval plan, realistic monthly cost modeling (including HOA and insurance), and a disciplined offer strategy. If you’re starting the process, begin with the mortgage pre-approval guide and the buyer resources hub.
Even though this guide is written for Ventura County, the decision structure and timeline management is directly transferable to LA County: first-time homebuyer guide (2026). The key is to treat the process as a series of controllable steps (financing, offer strategy, inspections, and risk management) rather than a single “big decision” made at the end. That approach reduces stress and typically improves outcomes.
Bottom line: The SFV is not one uniform market. Early 2026 is defined by micro-market behavior, payment sensitivity, inventory composition, and deal friction variables (like insurance). The most reliable way to navigate it is to pair neighborhood-level tracking via the SFV hub with a structured plan from the buyer resources and seller resources pages.
What This Means if You’re Buying in the Next 30–90 Days (Tactical Checklist)
- Define your “must-win” zone: target 1–2 submarkets and learn pricing patterns street-by-street using the SFV hub and neighborhood pages (e.g., Sherman Oaks).
- Set your payment ceiling first: run scenarios at current rates and +0.25% using the payment calculator and affordability calculator.
- Pre-underwrite where possible: strengthen your position with the steps in the mortgage pre-approval guide and your buyer resources hub.
- Choose financing intentionally: if FHA is on the table, confirm limits and constraints via FHA loan limits 2026 (LA County) before you fall in love with a property.
- Protect against deal friction: build insurance timelines into your plan (especially hillside/brush pockets) using the LA County insurance guide.
- Use list-to-sale reality: with a ~99.3% median ratio, negotiate when the home is substitutable; compete when it’s rare/turnkey (framework: buyer resources).
- Inspect strategically: focus on big-ticket risk and obtain HOA docs early for attached product; this matters most in rate-sensitive bands.
- Have a walk-away rule: avoid emotional overbidding unless the property truly checks your constraints; pressure-test numbers before you counter.
What This Means if You’re Selling in the Next 30–90 Days (Tactical Checklist)
- Start with the right playbook: use the seller resources hub to map prep, pricing, and launch timing.
- Price to the competition, not the neighbor’s peak: buyers are negotiating—position to be the best value in your bracket and reference nearby neighborhood benchmarks (e.g., Encino vs Van Nuys).
- Win the first 10 days: presentation and access matter more when buyers have options—use checklists in seller resources.
- Make appraisal easier: document upgrades, permits (if any), and comp logic by submarket to reduce renegotiation risk.
- Plan for insurance questions: if your property sits in a risk-sensitive zone, anticipate underwriting friction using the insurance guide.
- Offer strategy: don’t lead with concessions unless the property needs them—use them selectively to widen the buyer pool.
- Inspection posture: pre-inspect or pre-fix known issues when it reduces deal friction and renegotiation risk.
- Understand buyer math: review the buyer side using buyer resources so your pricing and marketing matches how buyers decide.
- Keep an eye on the 2026 backdrop: align your timing with the 2026 Southern California housing forecast.
Watchlist: 5 Things to Monitor Next Month
- Inventory: Do active listings rise after the holiday lull, and in which submarkets? Track from the SFV hub.
- Rates: Are we holding in the low-6% range or moving meaningfully up/down? Use affordability and payment models as rates move.
- Insurance & carrying costs: Any friction points (especially hillside/brush zones and older roofs)? Reference the insurance guide.
- Buyer demand: Watch pendings vs new listings (demand vs supply flow) and compare pockets like Studio City and North Hollywood.
- New listings quality: Turnkey supply vs “project homes” strongly influences the negotiation environment—use the seller resources hub to see what “turnkey” signals look like operationally.
For broader context, visit: LA County Real Estate and San Fernando Valley.
FAQ: San Fernando Valley Real Estate Market (January 2026)
Is the San Fernando Valley housing market a buyer’s or seller’s market right now?
What is the median home price in the San Fernando Valley (December 2025 closings)?
How long are homes taking to sell in the San Fernando Valley?
Are homes selling over asking in the SFV?
What’s happening with condos and townhomes vs single-family homes in the SFV?
How do mortgage rates impact the San Fernando Valley market?
Does this SFV market update include Burbank?
Reminder: Stats are sourced from the MLS and may change with late-reported updates.
Resources Hub
Use the resources below to turn this market update into a practical 2026 plan. The highest-leverage approach is to combine (1) neighborhood-level tracking, (2) financing clarity, and (3) a negotiation framework so you’re not making decisions based on headlines alone. If you’re a buyer, start with affordability and pre-approval, then narrow neighborhoods and inventory. If you’re a seller, start with preparation, pricing logic, and timing—then validate against the active competitive set.
- Los Angeles County real estate hub (market context and navigation)
- San Fernando Valley real estate hub (SFV navigation and micro-market tracking)
- Buyer resources (financing, offer strategy, checklists)
- Seller resources (pricing, prep, marketing, launch plan)
- Blog hub (all market updates and guides)
- 2026 housing forecast (rates, inventory, demand outlook)
- FHA loan limits (LA County) (payment-sensitive strategy)
- Insurance planning guide (risk + timeline management)
- Payment calculator (monthly payment modeling)
- Affordability calculator (range + rate sensitivity)
- Mortgage pre-approval guide (reduce offer friction)
- First-time buyer guide (process framework) (applies to LA County decisions too)
Quick SFV neighborhood links (placeholders): Sherman Oaks • Studio City • Encino • Tarzana • Woodland Hills • North Hollywood • Van Nuys
If you want to make this post even more “evergreen” for Google and AI search, the next best upgrade is to replace placeholders with (1) end-of-month active inventory, (2) new listings, and (3) pendings for the same data window. That trio allows you to compute months of supply and quantify demand flow in a way that search engines and readers both interpret as high-value local expertise.

Ventura County Mortgage Rates October 2026: 7.4% and What Buyers Should Do
Ventura County Mortgage Rates October 2026 October 2026 Mortgage Market Update Ventura County Mortgage Rates October 2026: 7.4% and What Buyers Should Do Now If you have been watching Ventura County mortgage rates October 2026 headlines this month, you already know the news is not pleasant. The national 30-year fixed rate averaged 7.40% in the week ending October 8, which is the highest reading since late 2023. However, a higher rate does not automatically mean you should stop shopping for a home. Instead, it means you need a sharper plan. In this guide, I break down why rates jumped, what the Fed may do next, what the new rate does to your monthly payment, and five practical moves for buyers in Camarillo, Thousand Oaks, Oxnard, Simi Valley, and the rest of the county. Discuss Your Buying Options → Calculate Your Payment 30-Year Fixed 7.40% October 8, 2026 15-Year Fixed 6.73% National Average Year-Ago Average 6.30% October 2025 Source: Freddie Mac weekly mortgage survey. National averages are not personalized lending quotes. Ventura County Mortgage Rates October 2026: Where We Stand Let’s start with the numbers. According to Freddie Mac‘s weekly survey, the 30-year fixed-rate mortgage averaged 7.40% as of October 8, up from 7.28% the week before and well above the 6.30% average a year ago. Meanwhile, the 15-year fixed averaged 6.73%. As a result, borrowers who qualified comfortably in the summer are now running the numbers all over again. The recent climb has been steady rather than sudden. Rates sat near 6.7% in early September, then moved to 6.95% by September 17. Next, they crossed 7% on September 24 for the first time since January 2025, and they have kept rising since. Therefore, this is not a one-week blip, and buyers should treat it as the new starting point for planning. Important distinction: Freddie Mac’s survey measures a national average for conventional, conforming loans with 20% down and excellent credit. Consequently, your actual quote in Ventura County may be higher or lower depending on your credit score, down payment, loan type, and whether you need a jumbo loan. If you want the previous month’s snapshot for comparison, you can read my September 2026 Ventura County mortgage rate update. Why Mortgage Rates Jumped Above 7% Mortgage rates do not follow the Fed’s policy rate directly. Instead, they track longer-term borrowing costs, especially the 10-year Treasury yield. Therefore, anything that pushes inflation expectations higher tends to push mortgage rates up as well. Several forces have combined this fall. First, energy prices have stayed elevated during the ongoing conflict with Iran, and that has kept inflation worries alive. Second, the Federal Reserve raised its target range by 0.25 percentage points on September 16, to 3.75%–4.00%. That was the first hike since July 2023. Additionally, Fed officials signaled that another increase is likely before year-end. For a deeper look at that decision, see my breakdown of what the September Fed rate hike means for Ventura County and LA buyers. Why This Matters for Homebuyers In short, lenders are pricing in a world where inflation stays stubborn and rates stay higher for longer. Because of that, even good economic news can nudge mortgage rates upward. What the Fed Does Next: Dates to Watch Buyers who are tracking rates should circle three dates. First, September’s Consumer Price Index report arrives on October 14. Second, Freddie Mac releases its next weekly rate survey on October 15. Finally, the Fed announces its next policy decision on October 28. OCT 14 Inflation Report September CPI OCT 15 Freddie Mac Weekly Rate Survey OCT 28 Federal Reserve Policy Decision Markets currently expect the Fed to hold steady in October, with traders pricing only about a 20% to 25% chance of a hike at that meeting. However, many analysts still expect another increase in December. As a result, a hot inflation report could push mortgage rates higher before the October meeting, while a soft report could give them some relief. Nobody can time this perfectly, and that is exactly why I recommend building a plan that works at today’s rate instead of a hoped-for rate. You can follow the official schedule on the Federal Reserve’s FOMC calendar. What 7.4% Does to Your Monthly Payment Numbers make the impact easier to see. The table below shows the principal-and-interest payment on a 30-year fixed loan at three recent rate levels. I used 20% down on three example home prices of $750,000, $1,000,000, and $1,200,000, which produce loan amounts of $600,000, $800,000, and $960,000. These are illustrative examples, not Ventura County medians. Loan Amount At 6.30% A Year Ago At 6.69% Early August At 7.40% October 2026 Monthly Increase vs. A Year Ago $600,000 $3,714 $3,868 $4,154 +$440/month $800,000 $4,952 $5,157 $5,539 +$587/month $960,000 $5,942 $6,188 $6,647 +$705/month On smaller screens, swipe horizontally to view the complete table. Payments are rounded estimates for principal and interest only, assuming a 30-year fixed-rate loan. Payment Difference $587 More Per Month On an $800,000 loan, the estimated monthly principal-and-interest payment rises from $4,952 at 6.30% to $5,539 at 7.40%. Notice that these figures exclude property taxes, homeowners insurance, and any HOA dues. Moreover, insurance costs have risen across California, so your real monthly housing cost will be higher than the table shows. To see how this changes your own budget, try the Ventura County mortgage calculator or read my guide on how much house you can afford in Ventura County. Ventura County Homebuyers Wondering What You Can Actually Afford? Higher mortgage rates don’t have to leave you guessing. Let’s discuss your budget, target neighborhoods, and opportunities to negotiate better purchase terms in Ventura County. Let’s Build Your Buying Strategy → Zac Wasserman | REALTOR® | RE/MAX ONE 5 Smart Moves for Ventura County Buyers Right Now Higher rates change the strategy, but they do not end the opportunity. Here is what I suggest. MOVE 01 Get Fully Pre-Approved and Compare Multiple Lenders Rate quotes can vary meaningfully from one lender to the next. Therefore, request at

Should You Sell Now or Wait Until Spring? Ventura County Fall/Winter 2026 Guide
Ventura County Home Seller Guide | Fall / Winter 2026 Should You Sell Now or Wait Until Spring? Ventura County Fall/Winter 2026 Guide By Zac Wasserman, REALTOR® (CA DRE# 02210760), RE/MAX ONE | Updated October 9, 2026 If you own a home in Ventura County and you’ve been thinking about listing, you’re probably asking one question: should you sell now or wait until spring? It’s a fair question, because the market changed this fall. Mortgage rates climbed to 7.40% in early October. The Federal Reserve raised rates for the first time since 2023, and the holidays are only a few weeks away. However, the local numbers tell a more useful story than the headlines do. In this guide, I’ll walk through what September’s MLS data shows and what each choice is likely to cost you. I’ll also explain how to decide based on your own situation. Should You Sell Now or Wait Until Spring? The Short Answer For most Ventura County homeowners, selling this fall makes sense if you need to move within the next six months. It also makes sense if you’re buying another home in the same market or if your home is ready to show today. On the other hand, waiting makes sense if your home needs work and your timeline is flexible. You should also be able to carry the home comfortably through winter. Therefore, the right answer depends less on the calendar and more on your price, your preparation, and your next move. Free Home Valuation → One thing is clear from the data, though: timing matters far less than pricing. In September, homes that were priced correctly sold in a median of 20 days at full price. Meanwhile, homes that needed a price reduction took a median of 70 days. As a result, a well-priced November listing can outperform an overpriced April listing. What the Ventura County Market Looks Like Heading Into Winter I pulled every closed sale in the county for September, and the full breakdown is in my September 2026 Ventura County market update. Here are the numbers that matter most for sellers: Closed sales: 489, compared with 497 in August Median sale price: $875,000 across all property types, and $950,000 for single-family homes Median days on market: 31 Median sale-to-list price ratio: 98.6%, down slightly from 99% in August Sellers who reduced their price before selling: 32% Sellers who paid a credit toward the buyer’s closing costs: 39%, with a median credit of $7,750 In other words, the market is steady but no longer forgiving. Prices are holding, and homes are still selling in about a month. However, roughly one in three sellers had to cut their price. In addition, nearly four in ten paid part of the buyer’s costs. Furthermore, most of those September closings went under contract in August, before rates jumped. Consequently, I expect the October and November data to show somewhat longer market times and more negotiation. How 7.40% Mortgage Rates Change the Math for Sellers According to Freddie Mac’s Primary Mortgage Market Survey, the average 30-year fixed rate reached 7.40% on October 8, 2026. That is up from 7.28% a week earlier and 6.30% a year ago. In addition, the September Fed rate hike lifted the federal funds range to 3.75%–4.00%, and several Fed officials have signaled that one more increase is possible before year-end. You can check upcoming meeting dates on the Federal Reserve’s FOMC calendar. So what does that mean for your buyer? For example, consider someone purchasing the county’s median-priced home at $875,000 with 20% down. At 6.30%, the principal and interest payment on a $700,000 loan is about $4,333 a month. At 7.40%, that same payment is about $4,847. Therefore, today’s buyer pays roughly $514 more every month than a buyer did a year ago for the same house. Because of that, buyers are more payment-sensitive than they were last spring. They negotiate harder, they ask for credits, and they walk away from homes that feel overpriced. Still, the buyers who are shopping right now are serious, because nobody tours homes at 7.40% for fun. Many of them have a job relocation, a lease ending, or a home they’ve already sold. It’s also worth being honest about what nobody knows. Rates could ease by next year if inflation cools. Alternatively, they could move higher if the Fed raises again. For that reason, waiting for a better rate environment is a bet, not a plan. The Case for Selling Now First, you’ll typically face less competition. Many homeowners delay listing once the holidays approach. As a result, the buyers who are still looking have fewer homes to choose from. A clean, well-priced home stands out. Second, you stop the clock on carrying costs. Every month you wait, you keep paying the mortgage, property taxes, insurance, and maintenance. For example, those costs might total $5,000 a month on your home. If so, waiting from November to April costs about $25,000 before you ever accept an offer. Your number will differ, so run it with your own bills. Third, if you’re also buying, the same conditions work in your favor on the purchase. In September, 39% of sellers paid a buyer credit and 32% cut their price. As a result, you’ll likely have room to negotiate on your next home. In fact, selling and buying in the same market often cancels out much of the timing risk. Finally, you avoid the uncertainty. Today’s prices are known: the county median is $875,000. In addition, well-priced homes are selling at full price in about three weeks. Next year’s prices and rates, however, are only a forecast. If you’re worried about where things are headed, I covered the longer outlook in my post on a possible housing market crash in 2027. The Case for Waiting Until Spring Waiting is a perfectly reasonable choice for some sellers, and I’d rather tell you that than push you to list. First, the spring market usually brings more buyers. Families often

San Fernando Valley Housing Market Update: September 2026 Prices, Trends & City-by-City Data
SEPTEMBER 2026 · MARKET UPDATE San Fernando Valley Housing Market Update: September 2026 Prices, Trends & City-by-City Data The median slipped under $1 million, but single-family prices moved just 1.1%. Here is what actually changed. Get My Free Home Valuation By Zac Wasserman, REALTOR® (CA DRE# 02210760), RE/MAX ONE. Published October 7, 2026. Based on 407 closed residential sales recorded in the MLS for September 1–30, 2026. The San Fernando Valley housing market crossed a line in September that people will notice: the median sold price slipped back under $1 million. However, the headline hides more than it reveals. Single-family prices barely moved, condo and townhome prices actually rose, and the real change is happening at the top of the market and in how long homes sit. Below, I break down what closed, what it sold for, and what it means for your next move. In this update:At a Glance|Median Price|Days on Market|Prices by City|Condos & Townhomes|Mortgage Rates|For Sellers|For Buyers|FAQ San Fernando Valley Housing Market at a Glance: September 2026 The median sold price in the San Fernando Valley was $950,000 in September 2026, based on 407 closed sales. Homes took a median of 29 days to sell and closed at roughly 99% of their final list price. Here are the Valley-wide numbers for the month: Closed sales: 407 (down from 446 in August) Median sold price, all homes: $950,000 (down from $1,007,500) Median price per square foot: $550 Median days on market: 29 (August: 28) Median sale-to-list ratio: 99% Sold at or above asking: 41% (August: 44%) Sold after at least one price cut: 35% Sales with a seller concession: 57% In short, fewer homes closed, the middle price came down, and buyers negotiated on more than half of all deals. Even so, speed held steady, which tells me demand is still there for homes that are priced correctly. For a side-by-side look, you can compare these figures with August's San Fernando Valley numbers. San Fernando Valley Median Home Price: Why It Slipped Below $1 Million A 5.7% one-month drop in the median sounds dramatic. However, it does not mean your home lost 5.7% of its value in thirty days, and here is why. First, look at single-family homes on their own. The median single-family sale was $1,170,000 in September, compared with $1,182,500 in August. That is a 1.1% move, which is ordinary month-to-month noise. Similarly, the median price per square foot for houses eased from $609 to $597. Second, look at what closed. Three of the Valley's most expensive communities posted much lower medians than the month before, because a different mix of homes sold there: Encino: $1,525,000 (August: $2,050,000) Studio City: $1,474,500 (August: $1,900,500) Calabasas: $1,550,000 (August: $1,911,500) As a result, the Valley-wide median was pulled down by fewer high-end closings in those areas, while most mid-priced neighborhoods held flat or rose. In other words, this was a mix shift far more than a price cut across the board. That said, the luxury tier still closed deals. Forty-six homes sold for $2 million or more, and nine closed above $5 million, led by a $12,000,000 sale in Encino. Meanwhile, 54% of all September sales closed under $1 million, which is where most of the buyer activity lives right now. How Fast Are Homes Selling? Days on Market and Price Cuts Speed is where this market splits in two. Overall, the median home sold in 29 days. However, that single number blends two very different experiences. On one hand, 27% of homes went under contract within two weeks. On the other hand, another 27% sat for more than 60 days. Therefore, a seller's outcome depends heavily on which group the home lands in, and pricing is what decides it. The data makes this point clearly. Homes that sold without a price reduction took a median of 19 days. Homes that needed a reduction took a median of 67 days, and the typical cut was about $50,000, or 5.6% of the original asking price. Consequently, overpricing by 5% cost those sellers roughly seven extra weeks and usually the same money in the end. Concessions matter too. In 57% of September sales, the seller contributed toward the buyer's costs, with a median credit of $26,000, or about 2.5% of the sale price. Because of that, the true net for many sellers is lower than the recorded sale price suggests. For example, a home that closed at "99% of list" with a 2.5% credit effectively sold closer to 96.5%. Finally, attached homes moved more slowly than houses. Single-family homes sold in a median of about 27 days, while condos took 38 days and townhomes took 47. San Fernando Valley Home Prices by City The table below covers every Valley community with at least eight closed sales in September. Smaller samples can swing sharply from month to month, so treat cities with fewer than 20 sales as directional. San Fernando Valley home prices by city, September 2026 City Sales Median Sold Price Median $/Sq Ft Median Days on Market Sale-to-List Sold After a Price Cut Calabasas 17 $1,550,000 $590 45 98% 47% Encino 50 $1,525,000 $628 24 98% 32% Studio City 24 $1,474,500 $676 25 97% 17% Sherman Oaks 43 $1,399,000 $683 29 98% 30% Tarzana 12 $1,337,500 $523 29 97% 25% Woodland Hills 59 $1,175,000 $572 27 98% 32% West Hills 29 $1,070,000 $516 23 99% 31% Lake Balboa 8 $902,000 $482 21 100% 25% Northridge 25 $875,000 $495 36 100% 60% Chatsworth 24 $856,000 $452 43 99% 50% North Hollywood 31 $845,000 $564 32 99% 58% Winnetka 18 $827,500 $441 34 99% 33% Reseda 14 $826,500 $505 28 100% 36% Canoga Park 17 $815,000 $504 36 99% 24% Van Nuys 24 $811,000 $490 47 100% 17% Panorama City 10 $730,000 $477 22 102% 30% A few patterns stand out. The entry-level Valley is the competitive Valley. Panorama City sold at a median of 102% of list, and 80% of its sales closed at or above asking. Likewise, about 85%
Ventura County Real Estate Market Update: September 2026
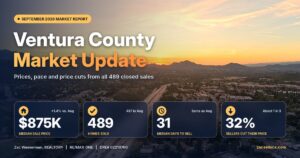
Ventura County’s September 2026 housing market: $875K median price, 489 closed sales, 31 days on market, and city-by-city data for buyers and sellers.

State Farm New Policies in California (2026): Who Qualifies & What Ventura County Homeowners Should Do
State Farm filed to start writing new California home policies again, but only for homes with an IBHS Wildfire Prepared Home designation. Here’s who qualifies, why you shouldn’t drop the FAIR Plan yet, and what Ventura County homeowners, buyers and sellers should do now.

Encino Real Estate in 2026: Homes, Prices & Neighborhood Guide
Encino real estate in 2026: see median home and condo prices, 494 closed sales, 91436 vs. 91316 trends, neighborhood insights, and tips for buyers and sellers.