
Median Home Price Woodland Hills CA (2026): What 759 Closed Sales Show
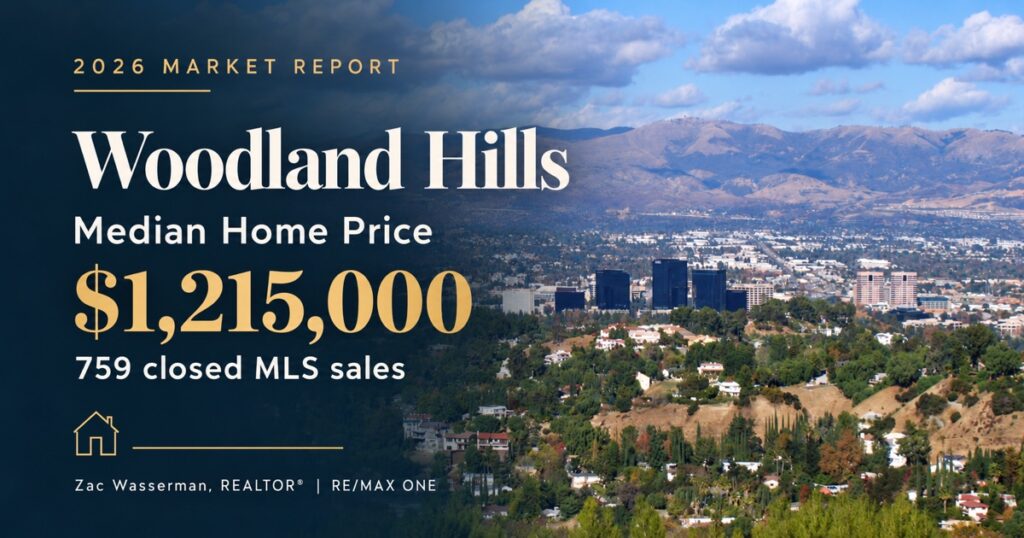
MLS closed residential sales • October 1, 2025–October 16, 2026 Median Home Price Woodland Hills CA (2026) Woodland Hills / 2026 Market Report Median Home Price Woodland Hills CA (2026): What 759 Closed Sales Show The median home price Woodland Hills CA buyers and sellers are seeing right now is $1,215,000 across every property type. That figure comes from 759 closed MLS sales between October 1, 2025 and October 16, 2026, and it only tells part of the story. Single-family homes closed at a median of $1,352,750, while condos closed at $510,000. As a result, one blended number can easily mislead you. Below, I break the market down by property type, ZIP code, size, and negotiating power so you can see what Woodland Hills homes are really selling for. – Zac Wasserman, REALTOR® with RE/MAX ONE What’s my home worth? → Plan my home search → $1.215M All-property median 759 Closed MLS sales 30 days Median time to contract Last updated: October 21, 2026 · MLS data through October 16, 2026 Median Home Price Woodland Hills CA: The Short Answer Here is the headline. Across all 759 closed sales, the median sale price was $1,215,000, and the average was about $1.36 million. However, a blended median hides a wide spread, because Woodland Hills sells everything from a $275,000 condo to a $6.7 million estate. Therefore, the most useful number depends on what you plan to buy or sell. Swipe or scroll to compare all columns → Median Home Price Woodland Hills CA: The Short Answer Metric All Types Single-Family Condos Townhomes Closed sales 759 606 91 58 Median sale price $1,215,000 $1,352,750 $510,000 $683,500 Median price per sq. ft. $600 $634 $532 $451 Median sale-to-list ratio 98.8% 98.9% 98.2% 98.5% Median days to contract 30 27 45 34 Four closings in another residential sub-type count toward the all-types column only. Additionally, every figure in this post comes from MLS closed-sale records for homes listed in Woodland Hills. Public home-value websites may show different medians because they use different date ranges, property mixes, and calculation methods. Woodland Hills Home Prices by Property Type Single-family homes drive this market. In fact, about 80% of closings were single-family, and the typical one was built in 1960, sits on roughly 10,850 square feet of land, and offers about 2,280 square feet of living space. Condos made up about 12% of sales, with a median size of 920 square feet. Townhomes made up about 8%, with a median size of 1,519 square feet. The price spread is wide, so it helps to see where sales actually landed: Under $1 million: about 32% of closings $1 million to $1.5 million: about 34% $1.5 million to $2 million: about 22% $2 million and above: about 12%, including 25 sales at $3 million or more Consequently, a buyer with a $900,000 budget has real options, mostly in smaller single-family homes, townhomes, and condos. Meanwhile, a buyer with $1.5 million will compete for larger homes on bigger lots. Median Home Price by ZIP Code: 91364, 91367, and 91303 Woodland Hills spans several ZIP codes, and the numbers differ more than you might expect. Swipe or scroll to compare all columns → Median Home Price by ZIP Code: 91364, 91367, and 91303 ZIP Code Closed Sales Median Price (All Types) Median Price (Single-Family) Single-Family Sales 91364 302 $1,371,000 $1,409,500 296 91367 438 $1,097,000 $1,360,000 295 91303 19 $990,000 $1,050,000 15 At first glance, 91367 looks cheaper. However, that gap is mostly a property-mix effect. About one-third of 91367 closings were condos or townhomes, while 91364 was almost entirely single-family. When you compare single-family homes only, the two ZIP codes sit within about $50,000 of each other. In addition, single-family homes in 91367 sold for a higher median price per square foot ($651 versus $615), which reflects their smaller average size. The 91303 sample is small, with just 19 closings, so treat it as directional rather than definitive. Is the Median Home Price Woodland Hills CA Rising or Falling? Over the past 12 months, prices have been steady rather than dramatic. For example, the single-family median for October through March was $1,355,000, and the median for April through September was $1,357,750. In other words, the typical single-family sale price barely moved. Swipe or scroll to compare all columns → Is the Median Home Price Woodland Hills CA Rising or Falling? Quarter Closed Sales Median Price (All Types) Median Price (Single-Family) Q4 2025 (Oct–Dec) 182 $1,190,000 $1,322,500 Q1 2026 144 $1,235,000 $1,450,000 Q2 2026 222 $1,254,500 $1,355,500 Q3 2026 183 $1,216,000 $1,362,000 The first quarter of 2026 looks like a spike, but a handful of high-end closings pulled that quarter’s single-family average up to about $1.72 million. Therefore, I would not read it as a trend. Closings also followed a seasonal pattern, peaking at 98 in June 2026 and bottoming out at 43 in January. Still, there are early signs of softening. Homes sold above their list price in about 36% of Q2 closings, compared with about 28% in Q3 and about 20% in September. Similarly, the single-family median price per square foot slipped from $656 in Q2 to $616 in Q3. Because October 2026 has only 28 closings so far, I would not draw conclusions from it yet. For wider context, see my San Fernando Valley market update for September 2026. What Buyers Pay: Sale-to-List Ratios, Days to Contract, and Concessions The median price tells you where the market sits. By contrast, the negotiation data tells you how much room you actually have. Sale-to-list ratio: The median Woodland Hills home sold for 98.8% of its final list price, and for 97.5% of its original list price. Above, at, and below list: About 30% of homes sold above list, about 11% sold exactly at list, and about 59% sold below list. Price reductions: About 32% of homes closed with a final list price lower than the original. Speed: The median home went into contract in 30 days. However, one-third
San Fernando Valley Housing Market Update: September 2026 Prices, Trends & City-by-City Data
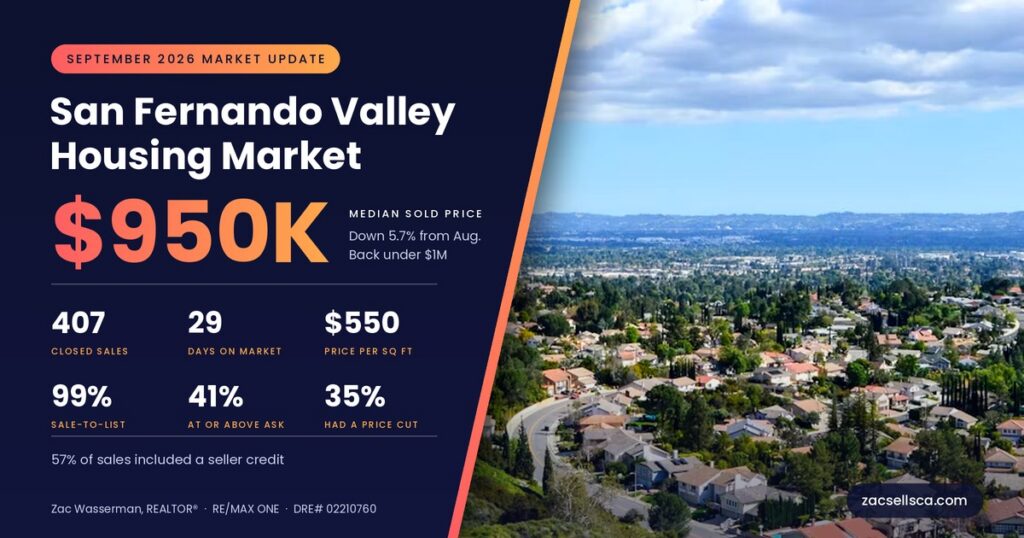
SEPTEMBER 2026 · MARKET UPDATE San Fernando Valley Housing Market Update: September 2026 Prices, Trends & City-by-City Data The median slipped under $1 million, but single-family prices moved just 1.1%. Here is what actually changed. Get My Free Home Valuation By Zac Wasserman, REALTOR® (CA DRE# 02210760), RE/MAX ONE. Published October 7, 2026. Based on 407 closed residential sales recorded in the MLS for September 1–30, 2026. The San Fernando Valley housing market crossed a line in September that people will notice: the median sold price slipped back under $1 million. However, the headline hides more than it reveals. Single-family prices barely moved, condo and townhome prices actually rose, and the real change is happening at the top of the market and in how long homes sit. Below, I break down what closed, what it sold for, and what it means for your next move. In this update:At a Glance|Median Price|Days on Market|Prices by City|Condos & Townhomes|Mortgage Rates|For Sellers|For Buyers|FAQ San Fernando Valley Housing Market at a Glance: September 2026 The median sold price in the San Fernando Valley was $950,000 in September 2026, based on 407 closed sales. Homes took a median of 29 days to sell and closed at roughly 99% of their final list price. Here are the Valley-wide numbers for the month: Closed sales: 407 (down from 446 in August) Median sold price, all homes: $950,000 (down from $1,007,500) Median price per square foot: $550 Median days on market: 29 (August: 28) Median sale-to-list ratio: 99% Sold at or above asking: 41% (August: 44%) Sold after at least one price cut: 35% Sales with a seller concession: 57% In short, fewer homes closed, the middle price came down, and buyers negotiated on more than half of all deals. Even so, speed held steady, which tells me demand is still there for homes that are priced correctly. For a side-by-side look, you can compare these figures with August's San Fernando Valley numbers. San Fernando Valley Median Home Price: Why It Slipped Below $1 Million A 5.7% one-month drop in the median sounds dramatic. However, it does not mean your home lost 5.7% of its value in thirty days, and here is why. First, look at single-family homes on their own. The median single-family sale was $1,170,000 in September, compared with $1,182,500 in August. That is a 1.1% move, which is ordinary month-to-month noise. Similarly, the median price per square foot for houses eased from $609 to $597. Second, look at what closed. Three of the Valley's most expensive communities posted much lower medians than the month before, because a different mix of homes sold there: Encino: $1,525,000 (August: $2,050,000) Studio City: $1,474,500 (August: $1,900,500) Calabasas: $1,550,000 (August: $1,911,500) As a result, the Valley-wide median was pulled down by fewer high-end closings in those areas, while most mid-priced neighborhoods held flat or rose. In other words, this was a mix shift far more than a price cut across the board. That said, the luxury tier still closed deals. Forty-six homes sold for $2 million or more, and nine closed above $5 million, led by a $12,000,000 sale in Encino. Meanwhile, 54% of all September sales closed under $1 million, which is where most of the buyer activity lives right now. How Fast Are Homes Selling? Days on Market and Price Cuts Speed is where this market splits in two. Overall, the median home sold in 29 days. However, that single number blends two very different experiences. On one hand, 27% of homes went under contract within two weeks. On the other hand, another 27% sat for more than 60 days. Therefore, a seller's outcome depends heavily on which group the home lands in, and pricing is what decides it. The data makes this point clearly. Homes that sold without a price reduction took a median of 19 days. Homes that needed a reduction took a median of 67 days, and the typical cut was about $50,000, or 5.6% of the original asking price. Consequently, overpricing by 5% cost those sellers roughly seven extra weeks and usually the same money in the end. Concessions matter too. In 57% of September sales, the seller contributed toward the buyer's costs, with a median credit of $26,000, or about 2.5% of the sale price. Because of that, the true net for many sellers is lower than the recorded sale price suggests. For example, a home that closed at "99% of list" with a 2.5% credit effectively sold closer to 96.5%. Finally, attached homes moved more slowly than houses. Single-family homes sold in a median of about 27 days, while condos took 38 days and townhomes took 47. San Fernando Valley Home Prices by City The table below covers every Valley community with at least eight closed sales in September. Smaller samples can swing sharply from month to month, so treat cities with fewer than 20 sales as directional. San Fernando Valley home prices by city, September 2026 City Sales Median Sold Price Median $/Sq Ft Median Days on Market Sale-to-List Sold After a Price Cut Calabasas 17 $1,550,000 $590 45 98% 47% Encino 50 $1,525,000 $628 24 98% 32% Studio City 24 $1,474,500 $676 25 97% 17% Sherman Oaks 43 $1,399,000 $683 29 98% 30% Tarzana 12 $1,337,500 $523 29 97% 25% Woodland Hills 59 $1,175,000 $572 27 98% 32% West Hills 29 $1,070,000 $516 23 99% 31% Lake Balboa 8 $902,000 $482 21 100% 25% Northridge 25 $875,000 $495 36 100% 60% Chatsworth 24 $856,000 $452 43 99% 50% North Hollywood 31 $845,000 $564 32 99% 58% Winnetka 18 $827,500 $441 34 99% 33% Reseda 14 $826,500 $505 28 100% 36% Canoga Park 17 $815,000 $504 36 99% 24% Van Nuys 24 $811,000 $490 47 100% 17% Panorama City 10 $730,000 $477 22 102% 30% A few patterns stand out. The entry-level Valley is the competitive Valley. Panorama City sold at a median of 102% of list, and 80% of its sales closed at or above asking. Likewise, about 85%
Encino Real Estate in 2026: Homes, Prices & Neighborhood Guide
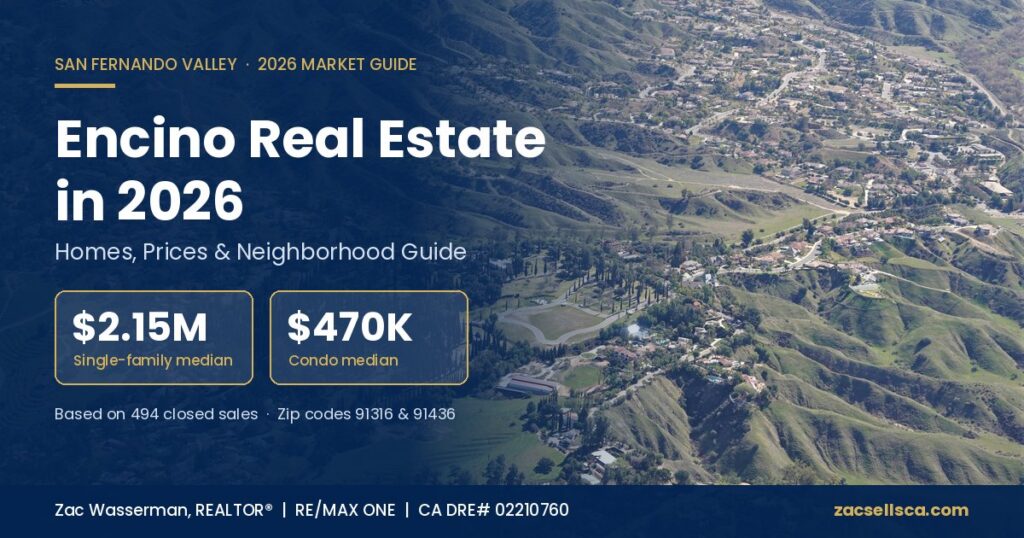
Encino real estate in 2026: see median home and condo prices, 494 closed sales, 91436 vs. 91316 trends, neighborhood insights, and tips for buyers and sellers.
Sherman Oaks Real Estate in 2026: Homes, Prices & What Buyers Should Know

Sherman Oaks real estate in 2026 shows a $1.688M median for single-family homes and $655K for condos and townhomes. See prices by ZIP code, days on market, seller concessions, and where buyers may still have negotiating room.
San Fernando Valley Housing Market Update: August 2026 Prices, Trends & City-by-City Data
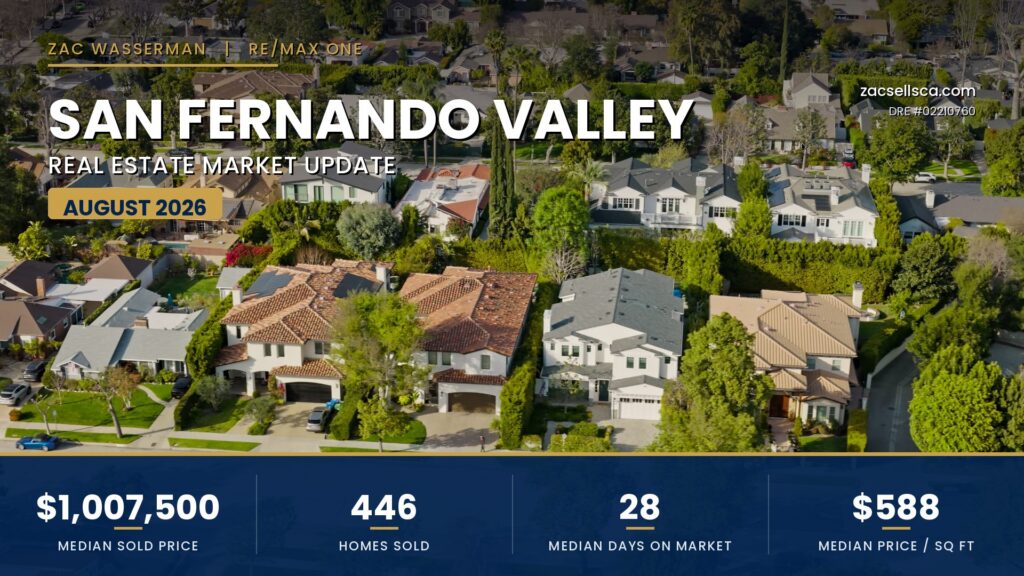
August 2026 • Local Market Report San Fernando Valley Housing Market Update: August 2026 Prices, Trends & City-by-City Data By Zac Wasserman, REALTOR®RE/MAX ONE • CA DRE# 02210760 Get My Free Home Valuation Plan My Next Move If you have been watching the San Fernando Valley housing market this summer, August delivered a clear message: prices are holding firm, well-priced homes are still moving quickly, and buyers finally have a touch more room to negotiate. As a licensed REALTOR® with RE/MAX ONE who works these neighborhoods every week, I pulled the closed-sale data for every San Fernando Valley community and broke it down so you can see exactly where the market stands heading into fall. Across the Valley, 446 homes closed escrow in August 2026. The numbers tell a story of a market that has settled into a steadier, more balanced rhythm than the frenzy of a few years ago — yet remains firmly a seller’s market in most price ranges. Let’s dig into what actually happened, city by city, and what it means whether you plan to buy, sell, or simply keep an eye on your home’s value. The San Fernando Valley Housing Market at a Glance: August 2026 Here is the high-level snapshot for all closed residential sales across the Valley last month: Median sold price (all homes): $1,007,500 Median price per square foot: $588 Median days on market: 28 Median sale-to-list ratio: roughly 99% Homes sold at or above asking: about 44% Total closed sales: 446 Therefore, the headline number is that the typical San Fernando Valley home is still closing right around the seven-figure mark. However, the more interesting signal sits just beneath it. Homes are selling at about 99% of their final list price, and only around 44% closed at or above asking — a meaningful shift from the days when nearly everything sold over list with multiple offers. Additionally, sellers gave up a little ground from their original asking price, with the typical home closing near 98% of where it first launched. As a result, pricing precision matters more now than it has in years. Meanwhile, mortgage rates stayed in the mid-6% range through August. According to Freddie Mac’s Primary Mortgage Market Survey, the 30-year fixed averaged 6.71% in early September — modestly higher than a year ago, but stable enough that buyers have adjusted their expectations rather than stepping away entirely. San Fernando Valley Median Home Prices in August 2026 The median home price is simply the midpoint — half of all homes sold for more, and half for less — which makes it a far more reliable gauge of the local market than the average, because a handful of multimillion-dollar estates can drag an average sky-high. In August, that Valley-wide median landed at $1,007,500. However, “the Valley” is really a patchwork of very different markets. Consequently, breaking the data down by property type reveals how wide the range truly is: Single-family homes: median $1,182,500 (median $609/sq ft, 27 days on market) Condominiums: median $495,000 (median $446/sq ft, 32 days on market) Townhomes: median $610,000 (median $367/sq ft, 31 days on market) In other words, a detached house in the Valley now runs nearly $1.2 million at the midpoint, while a condo remains one of the region’s most attainable footholds at under half a million. For buyers priced out of a single-family home, that spread is exactly why condos and townhomes keep drawing first-time and move-down buyers. Furthermore, for anyone weighing whether to stretch for a house, it helps to know precisely how much house can I afford in Los Angeles before touring anything. How Fast Are Homes Selling? Days on Market & Sale-to-List Speed tells you as much about a market as price does. In August, the median San Fernando Valley home went from active to pending in 28 days. Moreover, the pace was even quicker for sharply priced listings: roughly one-third of all homes sold within 14 days, and more than half were in escrow inside a month. That said, the market is no longer indiscriminate. Because buyers are more rate-conscious and more selective, the homes that linger tend to share a common thread — they launched above what the data supported. When a listing is priced correctly from day one, it still commands strong attention and frequently multiple offers. When it is not, it sits, and the eventual sale lands below the original ask. This is the single most important dynamic in today’s San Fernando Valley housing market: precision beats optimism. The sale-to-list ratio reinforces the point. At a median near 99%, sellers are still capturing almost all of their asking price. Nevertheless, the fact that fewer than half of homes closed over asking signals that the bidding-war reflex has cooled. For sellers, that makes an accurate, current valuation essential — and if you are curious what your own home would fetch in this market, you can start with a free home valuation. San Fernando Valley Home Prices by City This is where the Valley’s true character shows up. The following table breaks down median sold prices by city for August 2026, covering every community with a meaningful number of closed sales. As you will see, the Valley’s housing market spans well over a million dollars in range from its most affordable neighborhoods to its priciest enclaves. On smaller screens, scroll horizontally to see every column. August 2026 • Closed Residential Sales by City City Median Sold Price Median $/Sq Ft Median Days on Market Sale-to-List Encino $2,050,000 $699 36 99% Calabasas $1,911,500 $711 49 99% Studio City $1,900,500 $822 41 97% Sherman Oaks $1,427,500 $675 25 98% Tarzana $1,325,000 $604 37 98% Woodland Hills $1,215,500 $590 25 97% Northridge $1,100,000 $643 31 100% West Hills $1,040,000 $408 15 96% Chatsworth $905,000 $533 18 91% North Hollywood $850,000 $588 27 100% Winnetka $805,000 $484 24 100% Van Nuys $780,000 $485 36 100% Reseda $763,000 $410 28 100% Panorama City $717,500 $511 22 103% Canoga Park $560,000 $575 25 100%
San Fernando Valley Real Estate Market Update: July 2026
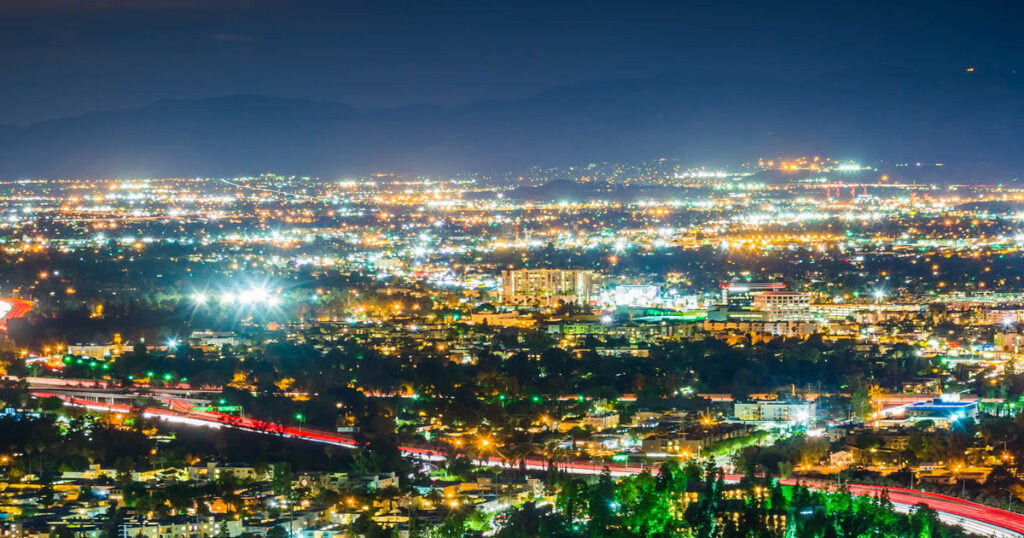
The San Fernando Valley housing market remained balanced in July 2026, with 516 closed sales, a median price of $947,500, and homes selling at 100% of asking price. See the latest city-by-city prices, days on market, seller concessions, and what the data means for buyers and sellers.
San Fernando Valley Real Estate Market Update: June 2026
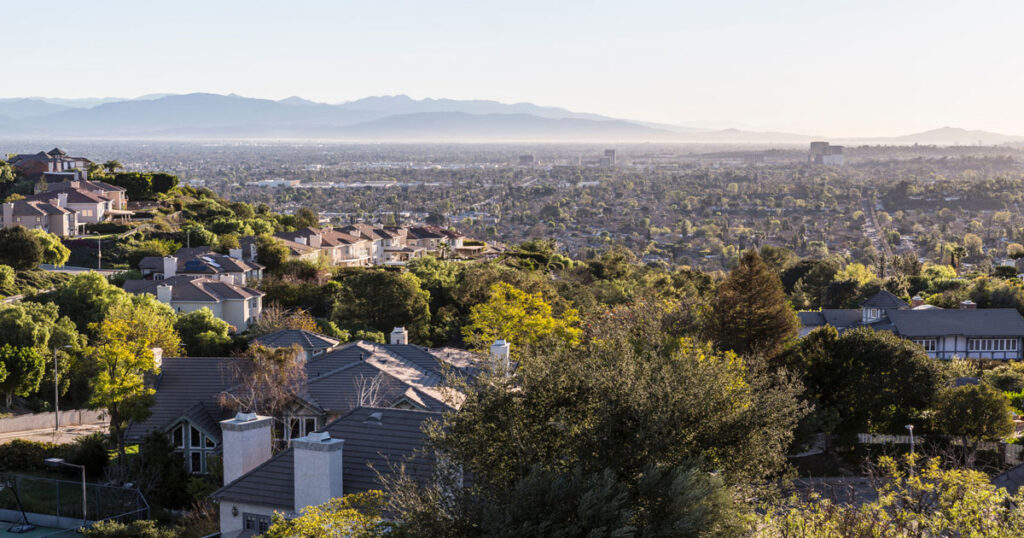
June 2026 SFV market data is in: $1.065M median price, 20-day DOM, and a full city-by-city breakdown — from Woodland Hills to Encino to North Hollywood. See what it means if you’re buying or selling right now.
San Fernando Valley Real Estate Market Update: May 2026
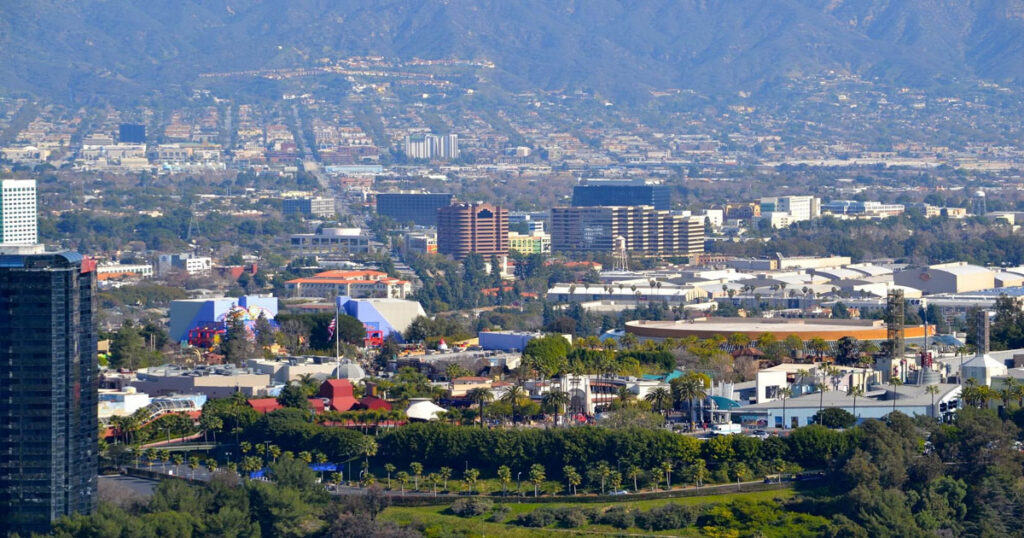
SFV closed 469 homes in May 2026 with a median sale price of $1,048,500. See prices by city, days on market, and what it means for buyers and sellers.
San Fernando Valley Real Estate Market Update: April 2026 — Prices, Trends & What to Expect
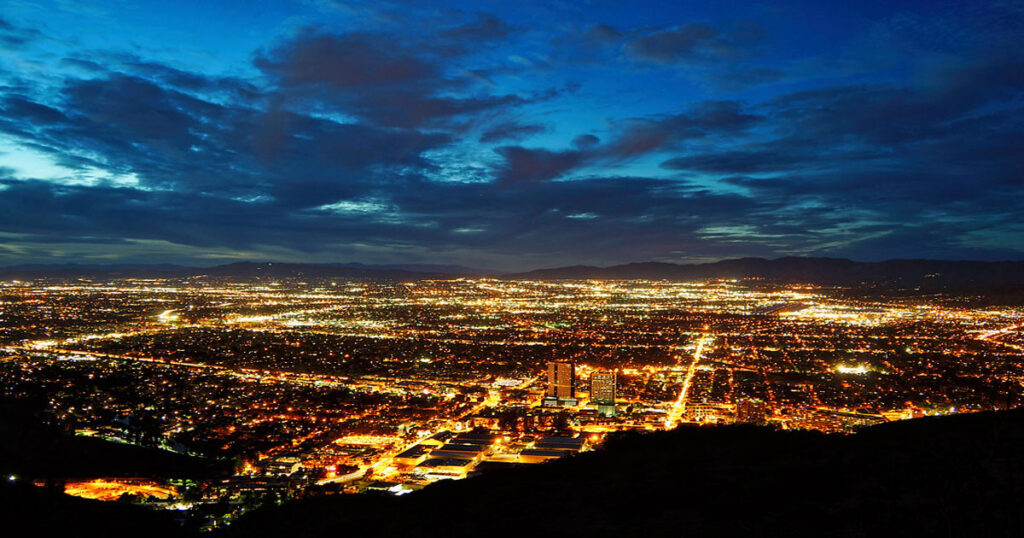
The San Fernando Valley real estate market in April 2026 shows a median closed price of $1,034,250 across 556 recent sales — with single-family homes hitting $1,224,500. Get the full city-by-city breakdown, days on market data, and what the 52.9% seller concession rate means for buyers and sellers right now.
San Fernando Valley Real Estate Market Update 2026
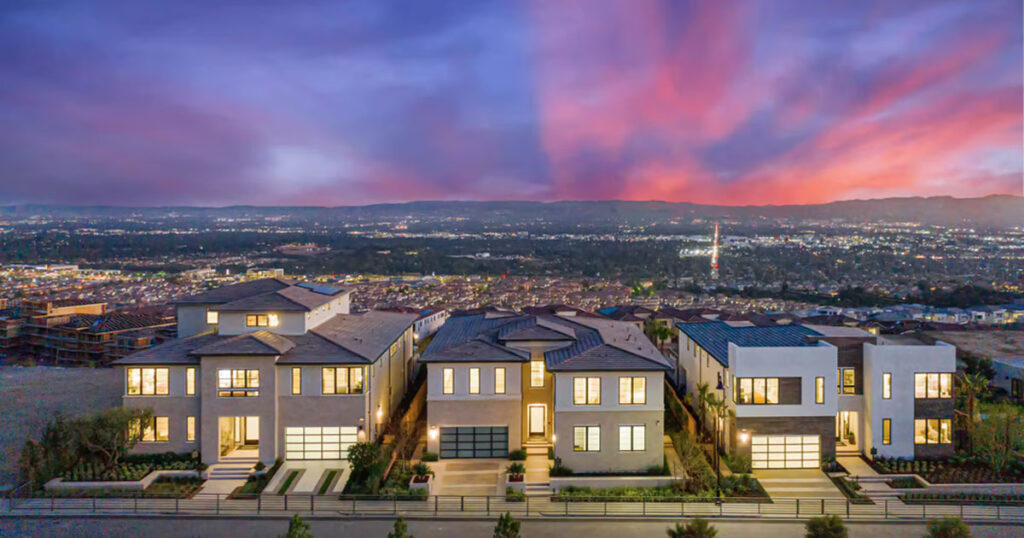
San Fernando Valley Real Estate Market Update 2026 San Fernando Valley Market Report Updated April 6, 2026 • By Zac Wasserman, REALTOR® • RE/MAX ONE • CA DRE# 02210760 San Fernando Valley Real Estate Market Update: Q1 2026 Zac Wasserman RE/MAX ONE 805.212.9147 zacsellsca@gmail.com @zacwasserman The San Fernando Valley Real Estate Market Update 2026 shows a market that is still moving with purpose. Demand stayed resilient in Q1, supply remained tight in many neighborhoods, and buyers continued to compete for homes that were priced correctly from day one. In other words, this was not a quarter where the market stalled out. Instead, it was a quarter where strategy mattered more than ever. This Q1 2026 report covers every major city across the Valley, from Studio City and Encino to Northridge, Van Nuys, and Panorama City, using actual MLS closed sales data. Whether you are trying to decide when to sell, trying to figure out what your budget buys right now, or comparing the Valley with neighboring markets, this report is built to give you numbers you can actually use. You will find median prices, price per square foot, days on market, and sale-to-list ratios for single-family homes, plus a separate condo and townhome breakdown. Just as importantly, you will see what those numbers mean in practical terms for buyers, sellers, and investors. If you want additional context, you can also review my February 2026 SFV market update and my January 2026 San Fernando Valley market update. Q1 2026 Quick Answer Box If you only read one section of this san fernando valley real estate market update 2026, read this: the Valley closed 901 single-family home sales in Q1 with a median price of $1,156,000, a median of 26 days on market, and an average sale-to-list ratio of 99.3%. That combination points to a seller-favoring environment for homes that show well and launch at the right number, while still leaving room for negotiation in select luxury pockets. Closed SFR Sales 901 Single-family home sales closed across the Valley in Q1 2026. Median Closed Price $1.156M Average price reached $1,540,193, lifted by the luxury tier. Median $ / Sq Ft $581 Premium submarkets posted significantly higher cost per square foot. Median DOM 26 Days Well-positioned homes typically moved into escrow inside a month. Avg SP / LP Ratio 99.3% Buyers still paid close to asking for attractive, move-in ready listings. Key Takeaway Tight Supply The strongest homes still earned fast attention, especially in entry-level and mid-tier segments. What this post covers Q1 2026 Market Overview: What the Numbers Are Telling Us San Fernando Valley Median Home Prices by City Condos and Townhomes: Q1 2026 Attached Home Data Days on Market: How Fast Are SFV Homes Selling? What’s Driving the San Fernando Valley Real Estate Market in 2026? Is Now a Good Time to Buy or Sell? What the Data Says San Fernando Valley Real Estate Market FAQ Work With a Local REALTOR® Who Knows the Valley Q1 2026 Market Overview: What the Numbers Are Telling Us The first quarter of the year gave us a very useful read on the san fernando valley real estate market update 2026. The Valley closed 901 single-family home sales in Q1 2026, with a median closed price of $1,156,000 and an average closed price of $1,540,193. That gap between the median and the average matters. It tells us the Valley still has a meaningful luxury layer, especially in Studio City, Encino, Tarzana, Sherman Oaks, and Calabasas, where a smaller number of high-end closings pull the average upward. At the same time, the median price per square foot landed at $581, while the median days on market came in at 26. Therefore, the market was not frozen, and it was not drifting. Instead, buyers remained active enough to keep pressure on inventory, especially in neighborhoods where homes felt relatively attainable compared with the Westside and other higher-cost LA County alternatives. If you are following both regions, it is worth comparing this report with my 2026 Ventura County housing market post and the latest Ventura County market update. The average sale-to-list ratio of 99.3% is another important clue in this market update. Buyers are paying very close to asking when homes are updated, clean, and priced with discipline. Conversely, homes that enter the market at an aspirational number are more likely to sit, negotiate, and lose momentum. Seller takeaway: pricing precision is still the difference between early leverage and later reductions. Buyer takeaway: there is still room to negotiate in selective luxury segments, but entry-level and move-up homes remain competitive. Investor takeaway: the Valley continues to attract attention because it offers more relative value than many higher-priced LA County submarkets. When I build a pricing strategy for a seller, I am not looking only at the headline median. I am looking at where buyer urgency is strongest, where price per square foot is holding, and where days on market are compressing. That is why local SFV housing data matters more than a broad Los Angeles County statistic. San Fernando Valley Median Home Prices by City This section is the core of this Q1 2026 report. City-by-city numbers matter because the Valley is not one uniform market. It is a collection of micro-markets with very different buyer pools, inventory profiles, and pricing ceilings. Studio City is competing on a different field than Panorama City. Sherman Oaks is not behaving exactly like Winnetka. Therefore, a serious seller or buyer should never make decisions based only on a countywide average. City Closed Sales Median Price $/SqFt Median DOM SP/LP Ratio Studio City 53 $2,260,000 $847 30 95.0% Calabasas 47 $1,850,000 $759 37 96.1% Tarzana 40 $1,816,250 $626 26 95.2% Encino 63 $1,783,943 $751 33 97.4% Sherman Oaks 91 $1,710,000 $822 27 95.9% Woodland Hills 112 $1,450,000 $612 22 97.8% Chatsworth 50 $1,167,500 $488 28 94.8% West Hills 84 $1,037,950 $617 24 97.8% Northridge 59 $987,000 $491 16 100.1% North Hollywood 63 $907,500 $595 28 97.4% Lake Balboa 22 $883,500 $686
Best Neighborhoods in Los Angeles County (2026 Guide by Budget & Lifestyle)
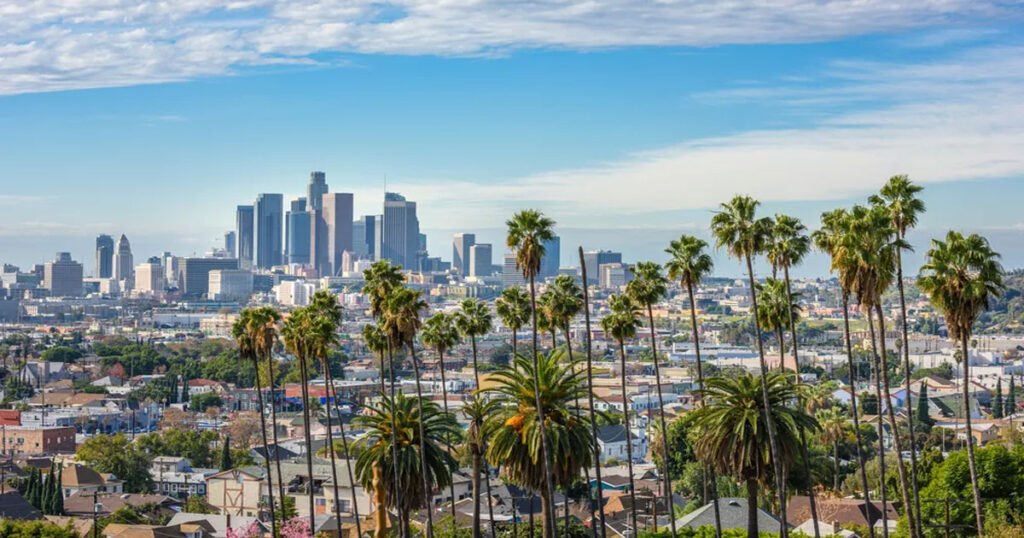
Discover the best neighborhoods in Los Angeles County for 2026 — ranked by budget, lifestyle, and family needs. From affordable SFV to luxury Westside, find your fit.
SFV Market Update — February 2026: What Changed + Who Has Leverage Now
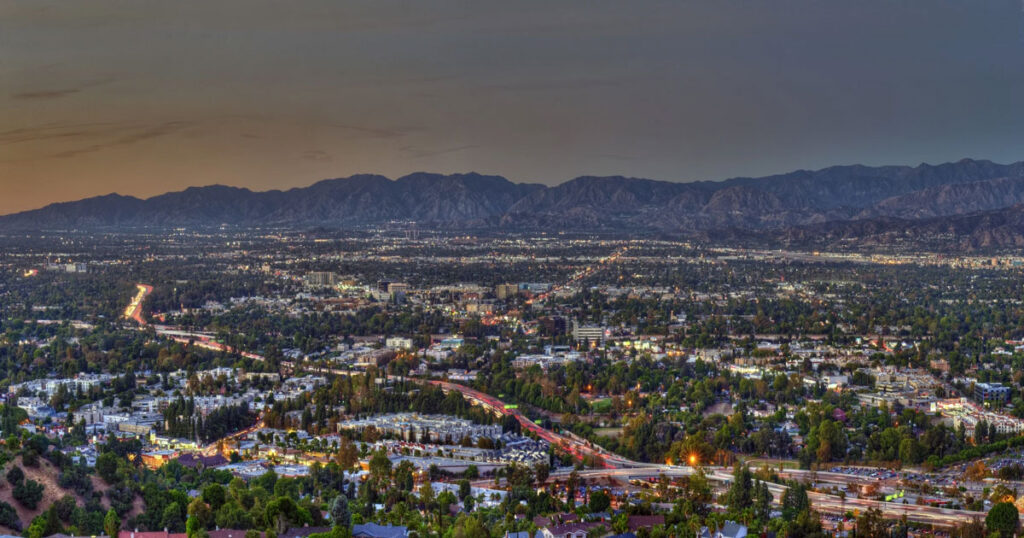
SFV Market Update Feb 2026: Prices, DOM & Leverage LAST UPDATED: February 28, 2026 San Fernando Valley Real Estate Market February 2026: What Changed + Who Has Leverage Looking for a clear San Fernando Valley real estate market February 2026 update? Below is a fast, skimmable snapshot of prices, inventory, days on market, and sale-to-list trends—plus what it means if you’re buying in the next 0–6 months or considering selling in the next 0–12. Snapshot + Takeaway (SFV — February 2026) Skimmable stats + what it means Median / Avg Price$920,000 / $1,115,000 Active Listings642 New Listings378 Sold Homes284 Median DOM28 Sale-to-List99.2% Trend to watch next month: Watch whether new listings continue outpacing sales—if inventory builds while DOM stays stable, buyer leverage may expand. What it means for sellers If DOM is 28 days and sale-to-list is 99.2%, the market is rewarding listings that are priced correctly early. The biggest risk is overpricing, going stale, and negotiating from behind. What it means for buyers If inventory is 642 active listings and DOM is 28 days, leverage depends on micro-area and condition. Your edge comes from payment realism and targeting listings where time-on-market is stretching. Local proof: I publish market updates designed to be decision-useful—focused on inventory, DOM, and sale-to-list because those are the levers that shift negotiating outcomes. Share your neighborhood + timeline and I’ll help you interpret the San Fernando Valley real estate market February 2026 stats for your micro-market segment. Simple qualifier to add to your form: Timeline: 0–3 months / 3–6 / 6–12 / just researching Weekly Market Email Weekly stats + what changed — no spam. Get the SFV market email once a week: the stats that moved, what changed, and what to watch next—so you’re not relying on headlines. Get Weekly SFV Updates Subscribe to the Market Email Thank you promise: One weekly email with the latest stats + a short “what changed” note—no spam. Home Value Report SFV only — comps-based range, not a generic estimate. Considering selling in the next 0–12 months? Get a comps-based SFV value range that accounts for condition, upgrades, and current competition. Request My SFV Value Range Get a Home Value Report Thank you promise: I’ll send a comps-based range and the key pricing factors buyers will compare you against. Buyer Buyability Call Best if you’re buying in the next 0–6 months. Buying soon? Do a quick buyability check—price range, payment range, and offer-readiness so you shop with confidence. Book a Buyability Call Confirm My Buying Range Thank you promise: You’ll leave with a clear buying-power range and the next two steps to get offer-ready. San Fernando Valley February 2026 Market Metrics A quick visual read on the core SFV numbers shaping buyer leverage, seller expectations, and overall market pace. Median Sold Price $920,000 Average Sold Price $1,115,000 Active Listings 642 New Listings 378 Closed Sales 284 Median Days on Market 28 Sale-to-List Ratio 99.2% MoM / YoY (Median) +1.8% / +3.7% These bars are scaled for quick visual comparison within each chart, so they are best used as a directional snapshot rather than a strict cross-metric ratio analysis. Top SFV Areas by Closed Sales Which SFV pockets drove the most transaction volume in February 2026. Sherman Oaks 52 Encino 44 Studio City 38 Woodland Hills 36 Northridge 31 Placed directly below the snapshot and CTA row so the charts stay above the fold and support quick scanning before the deeper market breakdown. San Fernando Valley Real Estate Market February 2026: Complete Market Snapshot Metric February 2026 Median price $920,000 Average price $1,115,000 Active listings 642 New listings 378 Sold homes (closed sales) 284 Median days on market (DOM) 28 Sale-to-list ratio 99.2% MoM change (median price) +1.8% YoY change (median price) +3.7% How to use this SFV snapshot The “right” interpretation depends on segment. In the San Fernando Valley real estate market February 2026, the most reliable way to apply these numbers is to use them as a baseline, then overlay three micro-market questions: (1) What are the closest comps in your neighborhood for similar condition and lot size? (2) How quickly are those comps going pending relative to the 28-day median? (3) Are closed sales landing near list (99.2%) or are they consistently closing lower because of concessions? Buyers can use the snapshot to decide where to negotiate (homes above the median DOM and those with recurring price reductions). Sellers can use it to decide how aggressive to be on pricing and terms: when sale-to-list stays near parity, the “best” listings are still clearing close to ask, but the market corrects overpricing quickly. San Fernando Valley Real Estate Market February 2026: Price Trends & Momentum February pricing doesn’t just answer “up or down”—it shows whether buyers are paying up for the best homes or negotiating harder on anything with friction. In the San Fernando Valley real estate market February 2026, the median at $920,000 and average at $1,115,000 point to segmentation: premium closings can lift the average even when most buyers are still shopping under $1M. The San Fernando Valley real estate market February 2026 pricing data shows the market rewarding quality and penalizing overreach. Upper-end sales in areas like Studio City and Encino helped pull the $1,115,000 average higher, while the $920,000 median reflects the more attainable core of the market. This gap between median and average is important: it means sellers can’t rely on countywide headlines when pricing—they need recent comps that match their specific segment, condition, and micro-location within the Valley. Practically, this means two different buyers can have two completely different experiences in the same month: a turnkey home in a premium pocket may attract multiple strong offers, while a similar-priced home with condition or location friction can sit and invite concessions. Reading price without pace (DOM) and final terms (sale-to-list) is where most people get misled. For national housing market context, see the National Association of REALTORS® existing home sales data. Local money-page context: If your budget lands near conforming vs
San Fernando Valley Real Estate Market Update January 2026)
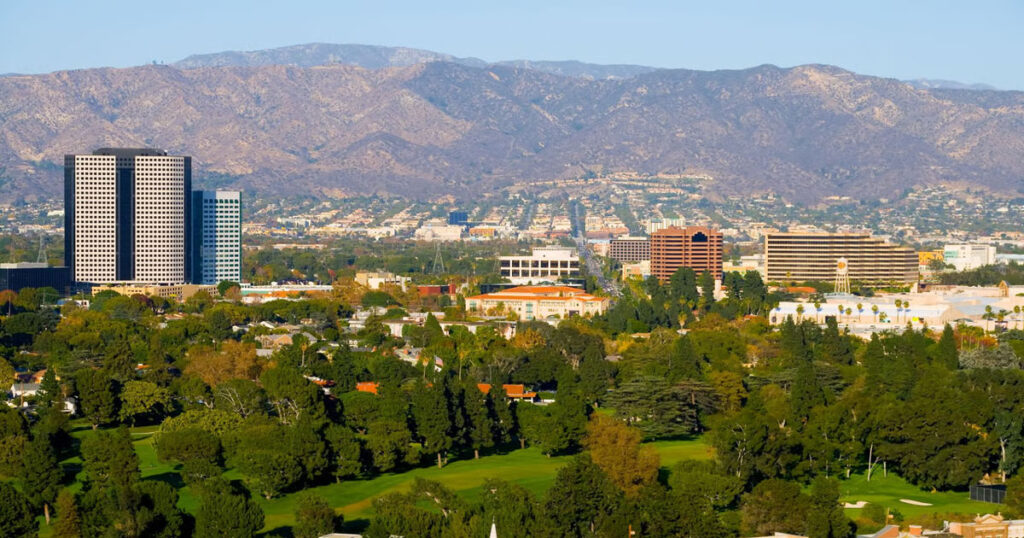
San Fernando Valley real estate market update for January 2026: MLS-driven prices, inventory, months of supply, days on market, sale-to-list, and city-by-city highlights—plus clear buyer/seller strategy for the next 30–90 days.
San Fernando Valley Real Estate Market Update (January 2026): Prices, Inventory & Trends
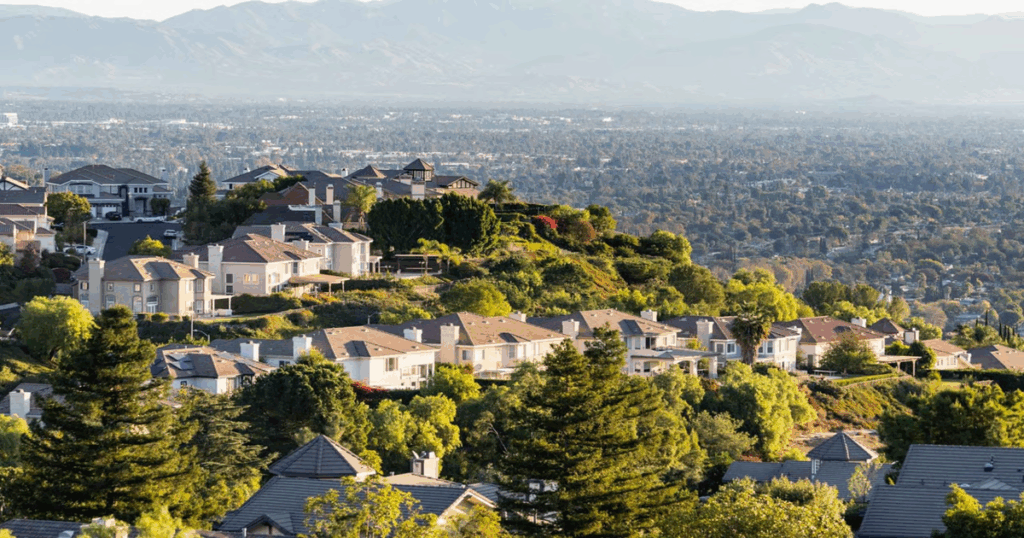
San Fernando Valley real estate market update for January 2026 using MLS closed sales from 12/1–12/31/2025. See the latest median price, inventory signals, days on market, list-to-sale ratio, and how mortgage rates are shaping leverage across key SFV submarkets.