
San Fernando Valley Market Report
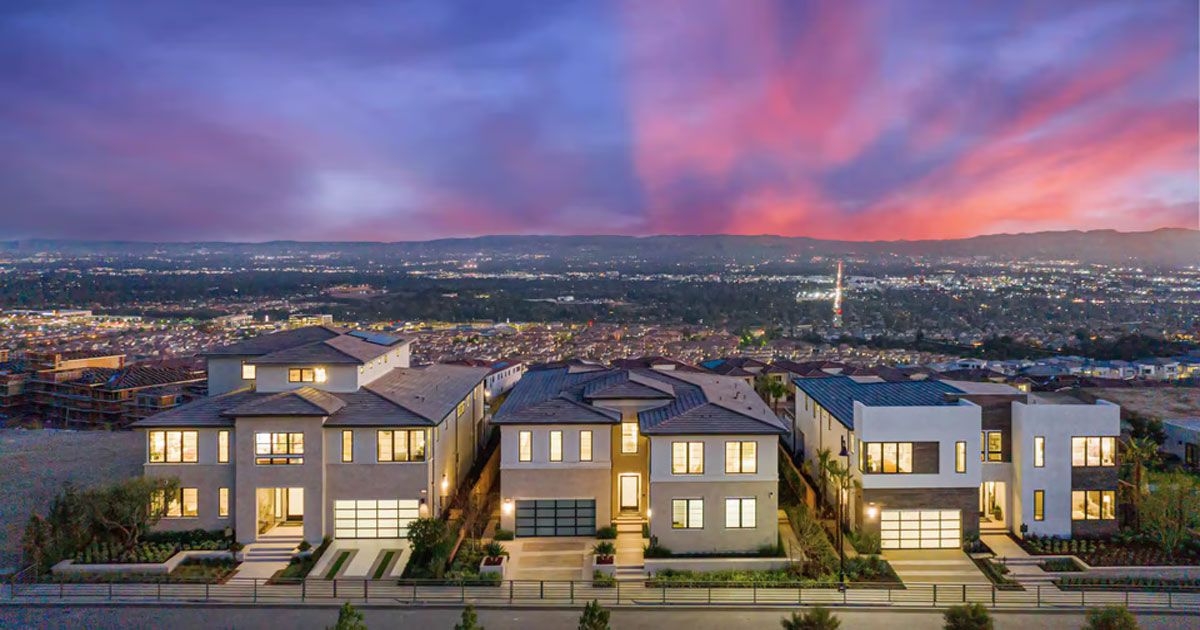
San Fernando Valley Real Estate Market Update: Q1 2026
The San Fernando Valley Real Estate Market Update 2026 shows a market that is still moving with purpose. Demand stayed resilient in Q1, supply remained tight in many neighborhoods, and buyers continued to compete for homes that were priced correctly from day one. In other words, this was not a quarter where the market stalled out. Instead, it was a quarter where strategy mattered more than ever.
This Q1 2026 report covers every major city across the Valley, from Studio City and Encino to Northridge, Van Nuys, and Panorama City, using actual MLS closed sales data. Whether you are trying to decide when to sell, trying to figure out what your budget buys right now, or comparing the Valley with neighboring markets, this report is built to give you numbers you can actually use.
You will find median prices, price per square foot, days on market, and sale-to-list ratios for single-family homes, plus a separate condo and townhome breakdown. Just as importantly, you will see what those numbers mean in practical terms for buyers, sellers, and investors. If you want additional context, you can also review my February 2026 SFV market update and my January 2026 San Fernando Valley market update.
Q1 2026 Quick Answer Box
If you only read one section of this san fernando valley real estate market update 2026, read this: the Valley closed 901 single-family home sales in Q1 with a median price of $1,156,000, a median of 26 days on market, and an average sale-to-list ratio of 99.3%. That combination points to a seller-favoring environment for homes that show well and launch at the right number, while still leaving room for negotiation in select luxury pockets.
Single-family home sales closed across the Valley in Q1 2026.
Average price reached $1,540,193, lifted by the luxury tier.
Premium submarkets posted significantly higher cost per square foot.
Well-positioned homes typically moved into escrow inside a month.
Buyers still paid close to asking for attractive, move-in ready listings.
The strongest homes still earned fast attention, especially in entry-level and mid-tier segments.
What this post covers
- Q1 2026 Market Overview: What the Numbers Are Telling Us
- San Fernando Valley Median Home Prices by City
- Condos and Townhomes: Q1 2026 Attached Home Data
- Days on Market: How Fast Are SFV Homes Selling?
- What's Driving the San Fernando Valley Real Estate Market in 2026?
- Is Now a Good Time to Buy or Sell? What the Data Says
- San Fernando Valley Real Estate Market FAQ
- Work With a Local REALTOR® Who Knows the Valley
Q1 2026 Market Overview: What the Numbers Are Telling Us
The first quarter of the year gave us a very useful read on the san fernando valley real estate market update 2026. The Valley closed 901 single-family home sales in Q1 2026, with a median closed price of $1,156,000 and an average closed price of $1,540,193. That gap between the median and the average matters. It tells us the Valley still has a meaningful luxury layer, especially in Studio City, Encino, Tarzana, Sherman Oaks, and Calabasas, where a smaller number of high-end closings pull the average upward.
At the same time, the median price per square foot landed at $581, while the median days on market came in at 26. Therefore, the market was not frozen, and it was not drifting. Instead, buyers remained active enough to keep pressure on inventory, especially in neighborhoods where homes felt relatively attainable compared with the Westside and other higher-cost LA County alternatives. If you are following both regions, it is worth comparing this report with my 2026 Ventura County housing market post and the latest Ventura County market update.
The average sale-to-list ratio of 99.3% is another important clue in this market update. Buyers are paying very close to asking when homes are updated, clean, and priced with discipline. Conversely, homes that enter the market at an aspirational number are more likely to sit, negotiate, and lose momentum.
- Seller takeaway: pricing precision is still the difference between early leverage and later reductions.
- Buyer takeaway: there is still room to negotiate in selective luxury segments, but entry-level and move-up homes remain competitive.
- Investor takeaway: the Valley continues to attract attention because it offers more relative value than many higher-priced LA County submarkets.
When I build a pricing strategy for a seller, I am not looking only at the headline median. I am looking at where buyer urgency is strongest, where price per square foot is holding, and where days on market are compressing. That is why local SFV housing data matters more than a broad Los Angeles County statistic.
San Fernando Valley Median Home Prices by City
This section is the core of this Q1 2026 report. City-by-city numbers matter because the Valley is not one uniform market. It is a collection of micro-markets with very different buyer pools, inventory profiles, and pricing ceilings. Studio City is competing on a different field than Panorama City. Sherman Oaks is not behaving exactly like Winnetka. Therefore, a serious seller or buyer should never make decisions based only on a countywide average.
| City | Closed Sales | Median Price | $/SqFt | Median DOM | SP/LP Ratio |
|---|---|---|---|---|---|
| Studio City | 53 | $2,260,000 | $847 | 30 | 95.0% |
| Calabasas | 47 | $1,850,000 | $759 | 37 | 96.1% |
| Tarzana | 40 | $1,816,250 | $626 | 26 | 95.2% |
| Encino | 63 | $1,783,943 | $751 | 33 | 97.4% |
| Sherman Oaks | 91 | $1,710,000 | $822 | 27 | 95.9% |
| Woodland Hills | 112 | $1,450,000 | $612 | 22 | 97.8% |
| Chatsworth | 50 | $1,167,500 | $488 | 28 | 94.8% |
| West Hills | 84 | $1,037,950 | $617 | 24 | 97.8% |
| Northridge | 59 | $987,000 | $491 | 16 | 100.1% |
| North Hollywood | 63 | $907,500 | $595 | 28 | 97.4% |
| Lake Balboa | 22 | $883,500 | $686 | 34 | 98.1% |
| Van Nuys | 72 | $880,000 | $533 | 20 | 99.0% |
| Winnetka | 36 | $869,500 | $416 | 28 | 98.8% |
| Canoga Park | 15 | $865,000 | $579 | 31 | 100.8% |
| Reseda | 39 | $825,000 | $591 | 27 | 99.0% |
| Panorama City | 24 | $745,000 | $644 | 37 | 100.2% |
*Encino average SP/LP was skewed higher by competitive bidding-war outliers; median SP/LP reflects a more typical transaction.
Studio City led the Valley at a $2,260,000 median, which makes it the highest-priced city in this Q1 2026 report. That premium is not random. Buyers are consistently paying for lifestyle, location, school district appeal, and access to Ventura Boulevard. Even with a 30-day median DOM and a 95.0% SP/LP ratio, Studio City still commands an elite price per square foot at $847.
Calabasas posted a $1,850,000 median at $759 per square foot, while Tarzana came in at $1,816,250 and Encino at $1,783,943. Together, those cities reinforce a broader theme in the Valley market: upper-tier neighborhoods still have pricing power, but buyers at that level are more selective and more deliberate. That is why median DOM stretches longer there than it does in some lower-price segments.
Sherman Oaks remains one of the Valley's most compelling markets. It came in at $1,710,000, with a striking $822 per square foot and a 27-day median DOM. Therefore, Sherman Oaks continues to balance prestige with practical demand. Buyers who want a central Valley location, strong neighborhood identity, and relatively convenient access to key LA job centers continue to anchor pricing there.
Woodland Hills led the Valley in transaction volume with 112 closed sales. That volume matters because it points to liquidity. A market with strong volume usually gives both buyers and sellers clearer pricing signals. At a $1,450,000 median, $612 per square foot, and 22-day DOM, Woodland Hills remains one of the most active, visible, and consistently traded areas in the Valley.
At the more affordable end of the single-family spectrum, Northridge, Van Nuys, Winnetka, Reseda, Canoga Park, and Panorama City continue to pull serious attention. Northridge stood out with a median price of $987,000, a median of just 16 days on market, and a 100.1% SP/LP ratio. That speed makes Northridge one of the most competitive sections of this report. Van Nuys also showed strong buyer urgency, posting a $880,000 median and a 20-day DOM. Panorama City, meanwhile, came in as the most affordable SFR market at $745,000, yet still recorded a 100.2% SP/LP ratio, which signals real competition at the entry level.
If you are trying to identify lifestyle fit in addition to raw price, my guide to the best neighborhoods in LA County can help add broader context around where different buyer profiles are focusing their search.
Need help pricing your home or narrowing your search?
This Q1 2026 report is useful at the macro level, but the real advantage comes from applying it to your specific street, property type, and price bracket. I can help you interpret the numbers for your exact situation.
Call: 805.212.9147 • Email: zacsellsca@gmail.com • Instagram: @zacwasserman
Condos and Townhomes: Q1 2026 Attached Home Data
The condo and townhome side of this market update tells a slightly different story. In Q1 2026, the Valley closed 314 attached-home sales, including 203 condos and 111 townhomes. The median closed price came in at $563,375, the median price per square foot was $439, and median days on market stretched to 40 days. So, compared with the single-family market, attached homes generally took longer to sell and showed more price elasticity.
That longer timeline is important. For buyers, it often means more room to negotiate, more time to review HOA documents, and a wider field of financing considerations. For sellers, it means presentation, HOA strength, reserve health, and building reputation can become just as important as the unit itself. In other words, the condo and townhome segment responds to a wider set of decision drivers than the detached-home market.
| City | Median Price | Median DOM |
|---|---|---|
| Studio City | $795,000 | 38 days |
| Sherman Oaks | $655,000 | 40 days |
| North Hollywood | $596,000 | 35 days |
| Chatsworth | $607,000 | 27 days |
| Woodland Hills | $555,000 | 49 days |
| Tarzana | $492,000 | 17 days |
| Van Nuys | $487,500 | 84 days |
| Encino | $413,500 | 55 days |
Tarzana was the fastest attached-home market at 17 median days, while Van Nuys was the slowest at 84 days. Encino also ran long at 55 days, which shows that even in higher-end areas, attached homes do not always track with the urgency we see in detached inventory. Therefore, buyers priced out of single-family homes should not assume all Valley options move at the same speed. In fact, this part of the report suggests that attached housing can open a meaningful opportunity window.
For first-time buyers and move-down buyers, the attached market matters because it creates sub-$700,000 entry points in multiple Valley cities. However, buyers should look past purchase price alone. HOA dues, reserve funding, special assessments, litigation, rental restrictions, and FHA or VA eligibility can materially affect both affordability and future resale. That is especially true if you are trying to stay within the 2026 conforming loan limits for Los Angeles County or comparing financing options using the jumbo loan thresholds in 2026.
Because the attached market is more nuanced, this report should be read alongside carrying costs. If you want to understand what cash to close may actually look like, my breakdown on closing costs for San Fernando Valley buyers is a useful next step.
Days on Market: How Fast Are SFV Homes Selling?
The median of 26 days on market is one of the most actionable numbers in this report. It tells us that well-priced homes are generally moving into escrow in under a month. Yet the spread between neighborhoods is meaningful. Northridge was the fastest at 16 days, followed by Van Nuys at 20 and West Hills at 24. At the slower end, Encino came in at 33, while Calabasas and Panorama City averaged 37 days.
That does not necessarily mean the slower markets are weak. More often, it reflects a more selective buyer profile, a higher price point, or a more complex decision process. Buyers in luxury segments usually tour more homes, compare more options, and negotiate more deliberately. Therefore, higher DOM in Studio City, Encino, Tarzana, or Calabasas should not be read the same way you would read higher DOM in a more price-sensitive market.
For sellers, the first 10 to 14 days remain critical. Once a listing misses that initial wave of attention, buyers start looking for defects in the pricing strategy rather than value in the home. As a result, the opening price in a market like Northridge, Van Nuys, or West Hills matters enormously. Sellers who treat the list price as a marketing tool tend to perform better than sellers who treat it like a wishlist number.
For buyers, this portion of the report should translate to preparation, not panic. Even in fast-moving areas, most buyers still have a short but workable decision window. However, pre-approval needs to be clean, proof of funds needs to be ready, and offer terms need to be structured intelligently. Hesitation can be costly, especially when you are competing in the Valley's more affordable detached-home pockets.
What's Driving the San Fernando Valley Real Estate Market in 2026?
Several overlapping forces are shaping the Valley market in Q1 2026. First, inventory remains the biggest constraint. The Valley has not seen a major surge in new supply, and while some new construction activity is appearing in outer western areas such as Chatsworth, many infill neighborhoods remain tight. That shortage keeps pressure on the best listings and helps explain why the average SP/LP ratio is still sitting so close to 100%.
Second, mortgage rates have stabilized, but they are still elevated enough to reshape buyer behavior. Many Q1 buyers were financing in the high-6% to mid-7% range. Consequently, some shifted toward smaller homes, attached housing, or relatively more affordable neighborhoods. Others focused more heavily on monthly payment than on purchase price. This is where financing education matters. Buyers should review the CFPB homebuying resources and also understand where the 2026 conforming loan limits for Los Angeles County sit in relation to their target price range.
Third, buyer migration patterns are still influencing the Valley. Some households that might previously have preferred the Westside or other premium LA neighborhoods are looking harder at the SFV because it can offer more space, better relative value, and a broader menu of detached-home options. Buyers comparing regional tradeoffs often move between this post, my guide on the cost of living comparison between Ventura County and LA, and my piece on the pros and cons of living near the Valley.
Fourth, insurance and risk conversations are part of the market again. Following major Southern California fire events, more buyers are asking not only what a home costs, but also what it costs to insure and maintain over time. That is one reason my post on home insurance in Southern California has become a more common companion resource for active buyers and homeowners.
Finally, investors and house-hackers remain active in selected value-driven neighborhoods. Panorama City, Van Nuys, North Hollywood, Canoga Park, and other lower-price pockets continue to draw attention from buyers looking for ADU potential, rental upside, or long-term appreciation. For broader context beyond hyperlocal MLS data, I recommend checking the latest National Association of REALTORS® research, California Association of REALTORS® market data, and U.S. Census Bureau housing data.
Is Now a Good Time to Buy or Sell? What the Data Says
For sellers, Q2 is typically the strongest seasonal window, and that pattern appears intact in these Q1 numbers. Buyer activity usually builds through spring, especially from April through June, as households try to get in position before summer transitions, school deadlines, and another possible leg of rate volatility. Therefore, sellers who are preparing now may be entering the market at a favorable moment.
That said, timing alone does not carry the deal. Presentation, prep, pricing, and launch execution still do the heavy lifting. A seller who enters in a strong seasonal window with weak marketing can still underperform. Conversely, a seller who launches with sharp photos, clean prep, and accurate pricing can create momentum quickly.
For buyers, waiting for spring inventory is not automatically a winning move. More listings can create more choice, but they can also create more competition. In a market where demand remains healthy, fresh inventory can simply draw more buyers into the field. As a result, the notion that spring always brings better deals does not hold up well in many parts of the Valley.
Buyers comparing lifestyle and budget tracks can review my guide to top neighborhoods by budget and lifestyle, along with the latest Ventura County market update and the broader 2026 Ventura County housing market report. Some SFV buyers find that Ventura County offers a better space-to-price ratio, while others confirm the Valley still gives them the commute or feel they want.
The best time to act is when your financing, goals, and strategy line up — for sellers, that means preparing now to catch spring demand; for buyers, it means moving before competition intensifies further.
Helpful next reads for Valley buyers and sellers
- February 2026 SFV market update
- January 2026 San Fernando Valley market update
- 2026 conforming loan limits for Los Angeles County
- closing costs for San Fernando Valley buyers
- cost of living comparison between Ventura County and LA
- pros and cons of living near the Valley
- home insurance in Southern California
- top neighborhoods by budget and lifestyle
San Fernando Valley Real Estate Market FAQ
Work With a Local REALTOR® Who Knows the Valley
This san fernando valley real estate market update 2026 is compiled from actual Q1 2026 MLS closed sales data, which is the same kind of data I use when pricing a listing, advising a buyer on offer strategy, or helping a client decide whether to move now or wait. Numbers are useful, but interpretation is what turns numbers into leverage.
If you are thinking about buying or selling anywhere in the San Fernando Valley, I can help you break down what the data means for your exact neighborhood, your budget, and your timeline. Whether you need a pricing strategy, a market-read conversation, or help comparing the Valley to surrounding markets, I am happy to help.
Work With a San Fernando Valley REALTOR®
Zac Wasserman | RE/MAX ONE
Phone: 805.212.9147
Email: zacsellsca@gmail.com
Website: zacsellsca.com
Instagram: @zacwasserman
CA DRE# 02210760
If you want help interpreting these numbers for your home, your offer, or your next move, reach out directly and I will walk you through it.
- All Posts
- Buyer Guides
- California Home Insurance & Wildfire Risk
- Home Financing (Mortgage & Loan Guides)
- Market Updates & Forecasts
- Seller Guides
- Back
- Ventura County Real Estate Market Updates
- San Fernando Valley Real Estate Market Updates (Monthly): Prices, Inventory & Trends

Median Home Price in Moorpark, CA (2026) Moorpark Housing Market 2026 Median Home Price in Moorpark, CA (2026): What Real...
Can ChatGPT sell your house in 2026? Here's what AI does well, where it falls short, and what it can...
Oxnard’s median home price is $785,000 in 2026, but prices vary sharply by zip code, property type, and neighborhood. See...

Oxnard’s median home price is $785,000 in 2026, but prices vary significantly by zip code and property type. Explore real...
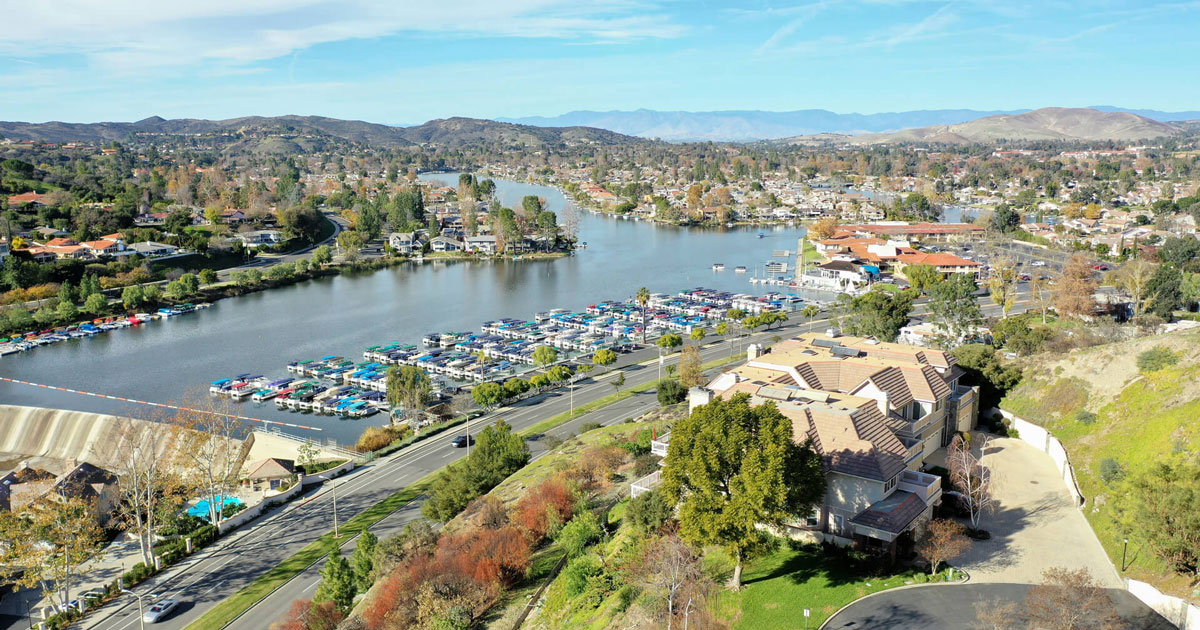
See June 2026 Westlake Village home prices, days on market, and sales trends, plus what current conditions mean for local...

Selling a distressed property in Ventura County can feel overwhelming, but homeowners often have more options than they realize. This...