
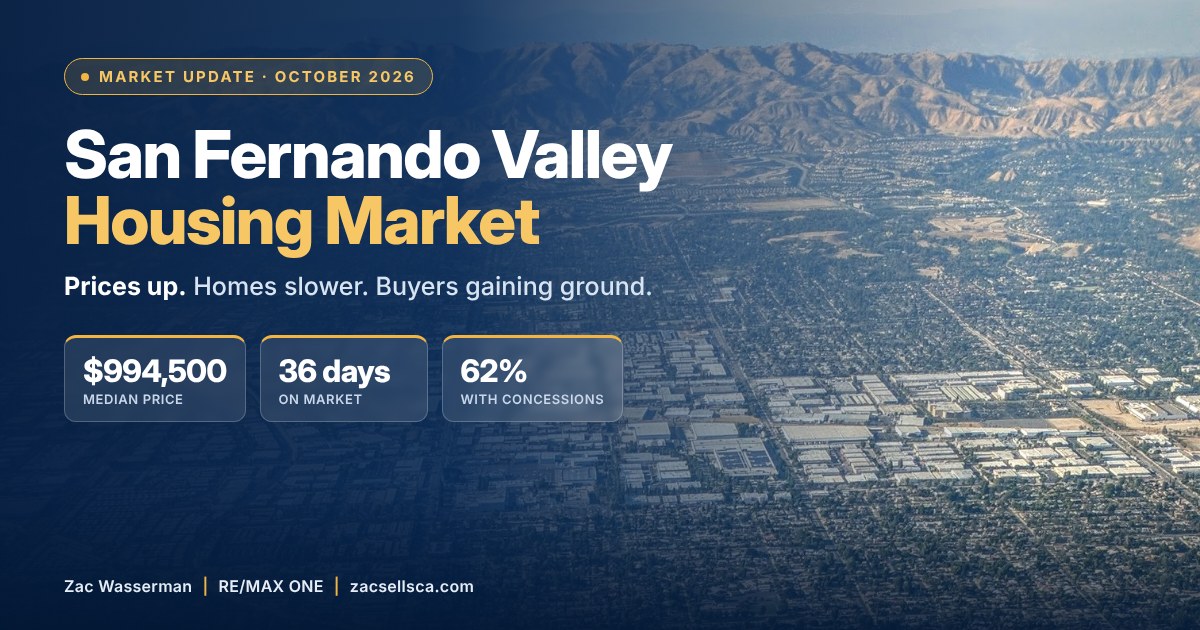
San Fernando Valley Housing Market Update: October 2026 Prices, Trends & City-by-City Data
By Zac Wasserman, REALTOR® (CA DRE# 02210760), RE/MAX ONE. Published November 2026. Based on 384 closed residential sales recorded in the MLS for October 1–31, 2026.
The San Fernando Valley housing market sent mixed signals in October. On one hand, the median sold price climbed back toward $1 million. On the other hand, homes took a week longer to sell, more sellers cut their price, and more buyers walked away with concessions. Below, I break down what closed, what it sold for, and what those two trends mean for your next move.
San Fernando Valley Housing Market at a Glance: October 2026
The median sold price in the San Fernando Valley was $994,500 in October 2026, based on 384 closed sales. Homes took a median of 36 days to sell and closed at about 98.3% of their final list price.
Here are the Valley-wide numbers for the month:
In short, prices rose while nearly every leverage indicator moved toward buyers. As a result, October looks less like a rebound and more like a market that is sorting itself out by price point. For a side-by-side look, compare these figures with the San Fernando Valley numbers for September.
Why the San Fernando Valley Median Price Rose in October
A 4.7% one-month jump in the median sounds like great news for sellers. However, it does not mean your home gained 4.7% in value in thirty days, and here is why.
First, look at what closed. In October, 54 sales closed at $2 million or more, including six at $5 million and up. The single largest was a $10 million estate in Calabasas. When that many high-end homes land in one month, the middle of the pack shifts upward even if no individual home got more valuable.
Second, look at price per square foot, which is a better like-for-like gauge. It rose from $550 to $566, or about 2.9%. That is a real gain, but it is far smaller than the jump in the headline median. In other words, buyers paid slightly more per foot, and they also bought larger, pricier homes.
Third, the single-family median rose 8.5%, from $1,170,000 to $1,270,000. Meanwhile, the median single-family home that closed was about 2,100 square feet. Therefore, a good share of that gain reflects bigger houses in pricier neighborhoods, not across-the-board appreciation.
Finally, the Valley is still split almost evenly around the $1 million mark. Exactly half of all October sales closed under $1 million, and 102 closed under $750,000. So, while the top end grabbed the headline, entry-level homes are still very much part of this market.
Homes Took Longer to Sell, and Buyers Gained Leverage
If the price story is mostly about mix, the speed story is about real behavior. Specifically, the median home sat 36 days in October, up from 29 days in September. That is the slowest pace this fall.
Here is how the timing broke down:
In addition, 39% of homes needed at least one price reduction before selling, and 62% of sales included a seller concession. Among those, the median concession was $26,250, which typically covers closing costs or a rate buydown.
So what does that tell me? Buyers are still showing up. However, they are negotiating harder, and they have more time to do it. Homes that are priced right and show well still move in two weeks. Homes that are priced on last spring's comps tend to sit, take a cut, and then sell with credits anyway.
San Fernando Valley Home Prices by City: October 2026
Valley-wide numbers only go so far. Consequently, here is how each community with at least eight October sales performed (all property types):
| City | Sales | Median Price | $/Sq Ft | Median DOM | Sale-to-List | At/Above Ask |
|---|---|---|---|---|---|---|
| Studio City | 24 | $1,825,000 | $679 | 58 | 98.5% | 33% |
| Encino | 29 | $1,540,000 | $668 | 71 | 96.7% | 31% |
| Calabasas | 20 | $1,470,000 | $589 | 29 | 97.4% | 30% |
| Tarzana | 22 | $1,415,000 | $627 | 34 | 97.4% | 23% |
| Sherman Oaks | 49 | $1,372,148 | $742 | 35 | 97.9% | 35% |
| Chatsworth | 26 | $1,230,000 | $497 | 33 | 98.5% | 27% |
| Woodland Hills | 45 | $1,120,000 | $553 | 44 | 97.3% | 24% |
| West Hills | 24 | $922,000 | $543 | 36 | 99.2% | 50% |
| Northridge | 28 | $910,500 | $477 | 32 | 100.0% | 57% |
| Lake Balboa | 12 | $892,000 | $548 | 37 | 99.4% | 42% |
| Winnetka | 20 | $830,000 | $512 | 52 | 99.2% | 45% |
| North Hollywood | 23 | $825,000 | $567 | 25 | 98.3% | 39% |
| Van Nuys | 23 | $790,000 | $551 | 46 | 98.9% | 35% |
| Reseda | 19 | $755,000 | $515 | 26 | 98.1% | 37% |
| Panorama City | 11 | $530,000 | $414 | 39 | 100.0% | 64% |
A few patterns stand out. To begin with, the luxury corridor along Ventura Boulevard did the slowest business. Encino homes took a median of 71 days, and Studio City took 58. Moreover, Encino buyers paid only 96.7% of list, the softest ratio in the Valley. If you are weighing those areas, my Encino real estate guide and Studio City real estate guide go deeper on the neighborhoods behind these numbers.
By contrast, the Valley's more affordable single-family pockets stayed competitive. Northridge sold at 100% of list with 57% of sales at or above asking, and West Hills hit 50%. Similarly, North Hollywood and Reseda moved fastest, at 25 and 26 days.
Sherman Oaks remains the Valley's price-per-foot leader at $742, while Woodland Hills sits in the middle at $553 with a 44-day pace. For more history on that market, see my Woodland Hills median home price breakdown.
Single-Family Homes vs. Condos and Townhomes
Property type matters just as much as location. In October, single-family homes made up 289 of the 384 sales, and condos and townhomes made up 93, or about 24%.
Single-family homes
- Median price per square foot: $595
- Median days on market: 36
- Sold at or above asking: 36%
Condos and townhomes
- Median price per square foot: $451
- Median days on market: 37
- Sold at or above asking: 41%
Interestingly, attached homes sold at or above asking slightly more often than houses. That makes sense, because a $595,000 condo is one of the few ways to own in the Valley on a single income. As a result, well-priced condos in Sherman Oaks, Encino and North Hollywood still draw multiple first-time buyers.
Among single-family homes, Studio City led at a $2,160,000 median, followed by Encino ($1,620,000), Chatsworth ($1,560,000), Calabasas ($1,550,000) and Sherman Oaks ($1,537,500). At the other end, Reseda ($787,475), Van Nuys ($821,500) and Winnetka ($845,000) offered the most accessible single-family prices among cities with eight or more house sales.
Mortgage Rates and the San Fernando Valley Housing Market
Rates explain a lot of what happened in the Valley this fall. According to the Freddie Mac Primary Mortgage Market Survey, the 30-year fixed rate averaged 7.40% in mid-October, the highest level of the year. Since then, it has eased to 7.24% as of October 29, 2026. A year earlier, the same rate averaged 6.17%.
That matters because most October closings were contracts written in September, when rates were climbing week after week. Consequently, buyers who stayed in the game asked for credits to buy down their rate, which helps explain why concessions rose to 62% of sales.
Here is the practical math. On the Valley's $994,500 median with 20% down, principal and interest at 7.24% runs about $5,422 a month. At 7.40%, the same loan costs about $5,509. That $87 difference is small on its own, yet it is the kind of margin that pushes a buyer from "yes" to "make me an offer I can't refuse." For the full rate picture, read my October mortgage rate breakdown.
What October Means for Valley Sellers
If you are thinking about listing, October's data points to three clear lessons.
- Price to today's buyer, not last spring's. Nearly four in ten homes needed a price cut. Therefore, starting at the right number usually nets more than starting high and chasing the market down.
- Budget for a concession. With 62% of sales including seller credits, plan for one from the start. A credit toward a rate buydown often beats an equal price cut, because it lowers the buyer's monthly payment more.
- Presentation still wins. One in four homes still sold within two weeks. Those listings were typically clean, well-photographed and priced at or just under the most recent comps.
Additionally, timing is a real question heading into the holidays. Fewer listings compete for attention in November and December, although buyer traffic also thins. If you are on the fence, my guide on whether to sell now or wait until spring walks through the tradeoffs. Better yet, start with a free home valuation so you are working from your own numbers.
What Could Your Home Sell For in Today's Market?
Get a clearer picture of your property's current market value using recent local sales and neighborhood-specific data.
Get Your Free Home ValuationNo obligation. Just a starting point for your next move.
What October Means for Valley Buyers
For buyers, October was the most negotiable month of the fall. Here is how to use that.
- Look at homes past 30 days. Almost a third of sales took more than 60 days. Those sellers are often open to credits, repairs or a lower price.
- Ask for a rate buydown. Because the median concession was $26,250, asking for help with your rate is normal, not aggressive.
- Move fast on the right home anyway. In Northridge, West Hills and Panorama City, half or more of sales still closed at or above asking. Leverage is uneven, so read each neighborhood separately.
If you are relocating from elsewhere in Los Angeles or out of state, my relocation guide to the San Fernando Valley covers commutes, schools and neighborhood fit. Likewise, if you are comparing the Valley with homes farther west, see the Ventura County market update for October.
San Fernando Valley Housing Market FAQ
What is the median home price in the San Fernando Valley right now?
The median sold price in the San Fernando Valley was $994,500 in October 2026, based on 384 closed sales. The median single-family home sold for $1,270,000, and the median condo or townhome sold for $595,000.
Are San Fernando Valley home prices going up or down?
The October median rose 4.7% from September, but much of that came from a larger share of high-end sales. Price per square foot, a better like-for-like measure, rose about 2.9%, from $550 to $566.
How long does it take to sell a home in the San Fernando Valley?
The median home took 36 days to sell in October 2026, up from 29 days in September. About 25% sold within 14 days, while 31% took more than 60 days.
Is the San Fernando Valley a buyer's or seller's market?
October leaned toward balanced, with buyers gaining ground. Only 37% of homes sold at or above asking, 39% took a price cut, and 62% of sales included a seller concession.
Which San Fernando Valley cities are most competitive right now?
Northridge, West Hills and Panorama City were the most competitive in October. Northridge sold at 100% of list price, and 57% of its sales closed at or above asking.
What is the most expensive city in the San Fernando Valley?
Studio City had the highest median price in October 2026 at $1,825,000 for all homes and $2,160,000 for single-family homes. Sherman Oaks had the highest price per square foot at $742.
Ready to Make Your Move in the Valley?
The San Fernando Valley housing market rewards people who read it neighborhood by neighborhood. Prices are holding, yet buyers have more room to negotiate than they have had all year. Whether you are selling in Sherman Oaks or buying your first condo in North Hollywood, the right strategy depends on your street, your price point and your timeline.
Ready to find out what your home is worth, or what you can really get for your budget? Contact Zac Wasserman at RE/MAX ONE, your local San Fernando Valley and Ventura County expert, for a free home valuation or a no-pressure strategy call.
Let's Build a Plan Around Your Goals
Whether you're selling your current home or searching for the right opportunity, get local market guidance tailored to your situation.
Zac Wasserman | RE/MAX ONE
REALTOR® | CA DRE# 02210760
Phone: 805.212.9147
Email: ZacSellsCA@gmail.com
Website: zacsellsca.com
Office:
30699 Russell Ranch Rd #100
Westlake Village, CA 91362
Data sourced from MLS closed residential sales, October 1–31, 2026, for Los Angeles County communities in the San Fernando Valley. Median figures are used throughout to reduce the impact of outlier sales. City figures include communities with at least eight sales. Information is deemed reliable but not guaranteed.
Hero photo: Browns Canyon Wash aerial, San Fernando Valley by [AUTHOR NAME], via Wikimedia Commons, licensed under CC BY 4.0. Cropped, with text overlay added.
- All Posts
- Buyer Guides
- California Home Insurance & Wildfire Risk
- Home Financing (Mortgage & Loan Guides)
- Market Updates & Forecasts
- Seller Guides
- Back
- Ventura County Real Estate Market Updates
- San Fernando Valley Real Estate Market Updates (Monthly): Prices, Inventory & Trends
The San Fernando Valley housing market sent mixed signals in October 2026: the median rose to $994,500, but homes took...
The Ventura County real estate market cooled in October 2026: 478 homes closed at an $857,500 median, down 2% from...
Moving to the San Fernando Valley: Your 2026 Relocation Guide Moving to the San Fernando Valley: Your 2026 Relocation Guide...
Studio City real estate by the numbers: a $2.1M median house, $797K condo, and 29 days on market, based on...
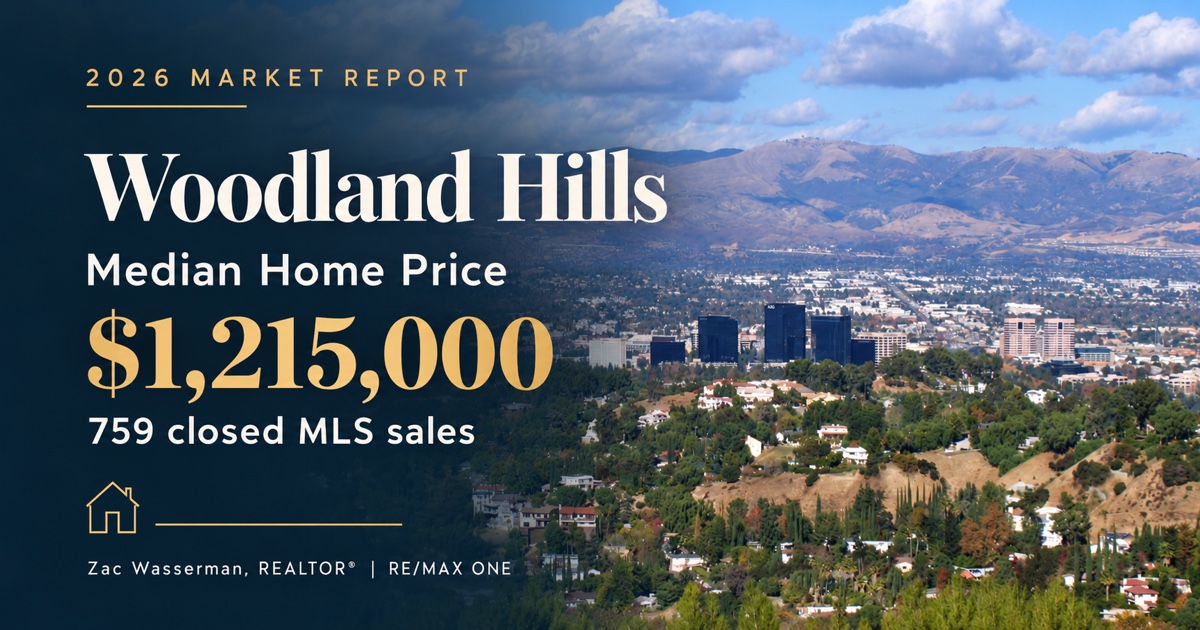
MLS closed residential sales • October 1, 2025–October 16, 2026 Median Home Price Woodland Hills CA (2026) Woodland Hills ...

New California real estate laws 2027 change what you can build, what your HOA can block, and how much notice...