
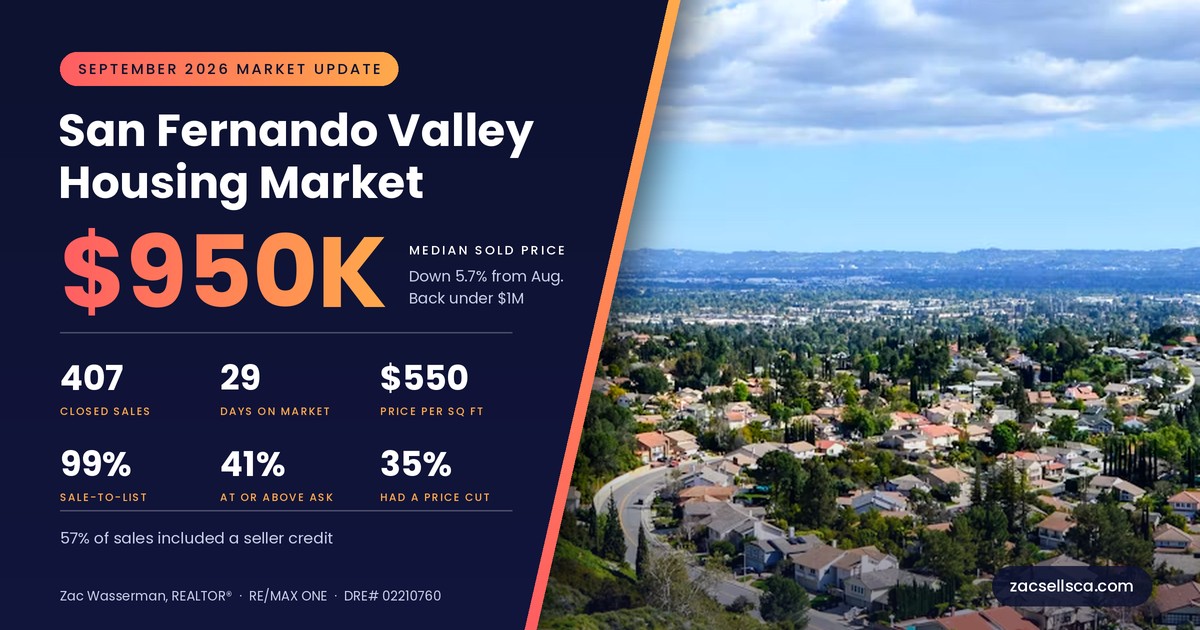
SEPTEMBER 2026 · MARKET UPDATE
San Fernando Valley Housing Market Update: September 2026 Prices, Trends & City-by-City Data
The median slipped under $1 million, but single-family prices moved just 1.1%. Here is what actually changed.
Get My Free Home ValuationBy Zac Wasserman, REALTOR® (CA DRE# 02210760), RE/MAX ONE. Published October 7, 2026. Based on 407 closed residential sales recorded in the MLS for September 1–30, 2026.
The San Fernando Valley housing market crossed a line in September that people will notice: the median sold price slipped back under $1 million. However, the headline hides more than it reveals. Single-family prices barely moved, condo and townhome prices actually rose, and the real change is happening at the top of the market and in how long homes sit. Below, I break down what closed, what it sold for, and what it means for your next move.
San Fernando Valley Housing Market at a Glance: September 2026
The median sold price in the San Fernando Valley was $950,000 in September 2026, based on 407 closed sales. Homes took a median of 29 days to sell and closed at roughly 99% of their final list price.
Here are the Valley-wide numbers for the month:
In short, fewer homes closed, the middle price came down, and buyers negotiated on more than half of all deals. Even so, speed held steady, which tells me demand is still there for homes that are priced correctly. For a side-by-side look, you can compare these figures with August's San Fernando Valley numbers.
San Fernando Valley Median Home Price: Why It Slipped Below $1 Million
A 5.7% one-month drop in the median sounds dramatic. However, it does not mean your home lost 5.7% of its value in thirty days, and here is why.
First, look at single-family homes on their own. The median single-family sale was $1,170,000 in September, compared with $1,182,500 in August. That is a 1.1% move, which is ordinary month-to-month noise. Similarly, the median price per square foot for houses eased from $609 to $597.
Second, look at what closed. Three of the Valley's most expensive communities posted much lower medians than the month before, because a different mix of homes sold there:
- Encino: $1,525,000 (August: $2,050,000)
- Studio City: $1,474,500 (August: $1,900,500)
- Calabasas: $1,550,000 (August: $1,911,500)
As a result, the Valley-wide median was pulled down by fewer high-end closings in those areas, while most mid-priced neighborhoods held flat or rose. In other words, this was a mix shift far more than a price cut across the board.
That said, the luxury tier still closed deals. Forty-six homes sold for $2 million or more, and nine closed above $5 million, led by a $12,000,000 sale in Encino. Meanwhile, 54% of all September sales closed under $1 million, which is where most of the buyer activity lives right now.
How Fast Are Homes Selling? Days on Market and Price Cuts
Speed is where this market splits in two. Overall, the median home sold in 29 days. However, that single number blends two very different experiences.
On one hand, 27% of homes went under contract within two weeks. On the other hand, another 27% sat for more than 60 days. Therefore, a seller's outcome depends heavily on which group the home lands in, and pricing is what decides it.
The data makes this point clearly. Homes that sold without a price reduction took a median of 19 days. Homes that needed a reduction took a median of 67 days, and the typical cut was about $50,000, or 5.6% of the original asking price. Consequently, overpricing by 5% cost those sellers roughly seven extra weeks and usually the same money in the end.
Concessions matter too. In 57% of September sales, the seller contributed toward the buyer's costs, with a median credit of $26,000, or about 2.5% of the sale price. Because of that, the true net for many sellers is lower than the recorded sale price suggests. For example, a home that closed at "99% of list" with a 2.5% credit effectively sold closer to 96.5%.
Finally, attached homes moved more slowly than houses. Single-family homes sold in a median of about 27 days, while condos took 38 days and townhomes took 47.
San Fernando Valley Home Prices by City
The table below covers every Valley community with at least eight closed sales in September. Smaller samples can swing sharply from month to month, so treat cities with fewer than 20 sales as directional.
| City | Sales | Median Sold Price | Median $/Sq Ft | Median Days on Market | Sale-to-List | Sold After a Price Cut |
|---|---|---|---|---|---|---|
| Calabasas | 17 | $1,550,000 | $590 | 45 | 98% | 47% |
| Encino | 50 | $1,525,000 | $628 | 24 | 98% | 32% |
| Studio City | 24 | $1,474,500 | $676 | 25 | 97% | 17% |
| Sherman Oaks | 43 | $1,399,000 | $683 | 29 | 98% | 30% |
| Tarzana | 12 | $1,337,500 | $523 | 29 | 97% | 25% |
| Woodland Hills | 59 | $1,175,000 | $572 | 27 | 98% | 32% |
| West Hills | 29 | $1,070,000 | $516 | 23 | 99% | 31% |
| Lake Balboa | 8 | $902,000 | $482 | 21 | 100% | 25% |
| Northridge | 25 | $875,000 | $495 | 36 | 100% | 60% |
| Chatsworth | 24 | $856,000 | $452 | 43 | 99% | 50% |
| North Hollywood | 31 | $845,000 | $564 | 32 | 99% | 58% |
| Winnetka | 18 | $827,500 | $441 | 34 | 99% | 33% |
| Reseda | 14 | $826,500 | $505 | 28 | 100% | 36% |
| Canoga Park | 17 | $815,000 | $504 | 36 | 99% | 24% |
| Van Nuys | 24 | $811,000 | $490 | 47 | 100% | 17% |
| Panorama City | 10 | $730,000 | $477 | 22 | 102% | 30% |
A few patterns stand out.
The entry-level Valley is the competitive Valley. Panorama City sold at a median of 102% of list, and 80% of its sales closed at or above asking. Likewise, about 85% of Reseda sales closed at or above asking. Buyers priced out of the south-of-the-boulevard neighborhoods are clearly concentrating here.
The upper tier is negotiating. In contrast, only 1 of Tarzana's 12 sales closed at or above asking, and Studio City and Sherman Oaks both came in under 30%. If you are shopping in these areas, my Encino real estate guide and Sherman Oaks real estate guide cover the neighborhood-level detail.
Price cuts cluster in three cities. Northridge (60%), North Hollywood (58%), and Chatsworth (50%) had the highest share of sales that needed a reduction first. Therefore, sellers in those communities should be especially careful with their opening price.
Woodland Hills remains the volume leader. With 59 closings, it accounted for roughly one in seven Valley sales, followed by Encino with 50 and Sherman Oaks with 43.
Condos and Townhomes: Where Prices Actually Rose
While the overall median fell, attached homes moved the other way. Condos and townhomes made up one-quarter of September sales, and both categories posted higher medians than in August.
- Condominiums: $566,500 median across 58 sales (August: $495,000), at $451 per square foot
- Townhomes: $647,500 median across 44 sales (August: $610,000), at $434 per square foot
However, higher prices did not mean easier sales. Townhomes had the highest price-cut rate of any property type at 43%, and they took the longest to sell. Additionally, buyers of attached homes should budget carefully for HOA dues and insurance, because both affect monthly cost and loan approval as much as the purchase price does.
For first-time buyers, this segment is still the most realistic way into the Valley. Fifty-one homes closed under $600,000 in September, and nearly all of them were condos or townhomes.
Mortgage Rates Hit 7.28%: What October Will Look Like
September's closed sales are a rear-view mirror. Most of those buyers locked their rates in August, when the 30-year fixed averaged roughly 6.7%. Since then, the picture has changed.
According to Freddie Mac's Primary Mortgage Market Survey, the 30-year fixed rate averaged 7.28% on October 1, up from 7.03% a week earlier and 6.34% a year ago. That jump followed the Federal Reserve's quarter-point increase in September. I covered the background in what the September 2026 Fed rate hike means for buyers.
Here is what that means in dollars. On a $950,000 purchase with 20% down, principal and interest runs about $4,909 per month at 6.71%. At 7.28%, it runs about $5,200. As a result, the same house now costs roughly $290 more every month, before taxes and insurance.
Consequently, I expect October and November closings to show more price reductions, more seller credits, and longer market times, particularly above $1.5 million. On the other hand, well-priced homes under $900,000 should keep moving, because that is where demand is deepest.
What the San Fernando Valley Housing Market Means for Sellers
If you are thinking about selling, the September data points to four practical conclusions.
- Price to the last 30 days, not last spring. Homes that needed a cut took 67 days instead of 19. Therefore, your first price is your most important marketing decision.
- Plan for a concession. More than half of sellers gave one. Accordingly, build a 2% to 3% credit into your net sheet from the start so it does not surprise you in escrow.
- Know your tier. Sellers under $900,000 still have leverage in much of the Valley. Sellers above $1.5 million are competing for a smaller pool of buyers who now face 7% financing.
- Do not wait for a better rate environment without a reason. Higher rates reduce what buyers can pay. Because of that, a home that is ready now may net more this fall than it would after another quarter of softening.
Most importantly, a Valley-wide median tells you very little about one specific house. A proper valuation looks at your street, your condition, and what closed nearby in the last 60 days.
What does this market mean for your home?
Get My Free Home ValuationWhat It Means for Buyers
Buyers have more room to negotiate than they have had in a long time, although the monthly payment is harder. Here is how I would use this market.
- Ask for credits instead of chasing price. With 57% of sales including a concession, a seller-paid rate buydown is often worth more to you than a small price reduction. For instance, a $26,000 credit can buy your rate down meaningfully for the first years of the loan.
- Target homes with 45+ days on market. More than a quarter of September sales sat past 60 days. Those sellers are usually the most flexible.
- Move fast in the entry-level cities. In contrast, Panorama City, Reseda, and Lake Balboa are still selling at or above asking, so bring your strongest offer there.
- Re-run your numbers at today's rate. A pre-approval from August may no longer fit. Start with how much house you can afford in Los Angeles and then confirm with your lender.
Additionally, if your search stretches west over the county line, compare these numbers with the Ventura County real estate market update for September, where the median was $875,000.
Make your next offer with a clear plan.
Talk Through My Buying OptionsSan Fernando Valley Housing Market FAQ
What is the median home price in the San Fernando Valley right now?
The median sold price in the San Fernando Valley was $950,000 in September 2026, based on 407 closed sales. Single-family homes had a median of $1,170,000, condominiums $566,500, and townhomes $647,500.
Are home prices in the San Fernando Valley going down?
The overall median fell 5.7% from August, from $1,007,500 to $950,000. However, the single-family median dipped only 1.1%, and condo and townhome medians rose. Most of the drop came from fewer high-end sales in Encino, Studio City, and Calabasas rather than from falling values across the board.
Is the San Fernando Valley a buyer's or seller's market?
It depends on the price range. Under roughly $900,000, sellers still have the advantage, and cities such as Panorama City and Reseda are selling at or above asking. Above $1.5 million, buyers have more leverage, with more price cuts and fewer sales over asking.
How long does it take to sell a home in the San Fernando Valley?
The median was 29 days in September 2026. Homes that sold without a price reduction took a median of 19 days, while homes that needed a reduction took a median of 67 days.
Which San Fernando Valley city is the most affordable?
Among cities with at least eight sales in September 2026, Panorama City had the lowest median sold price at $730,000, followed by Van Nuys at $811,000 and Canoga Park at $815,000.
How do higher mortgage rates affect San Fernando Valley buyers?
The 30-year fixed rate averaged 7.28% on October 1, 2026, according to Freddie Mac. On a $950,000 home with 20% down, that adds roughly $290 per month in principal and interest compared with the rates buyers locked in August.
Ready to Make Your Move in the Valley?
Numbers like these are a starting point. However, your decision comes down to one home, one street, and one set of goals. If you want to know what your home would sell for in today's San Fernando Valley housing market, or how far your budget goes at current rates, I am happy to walk you through it with no pressure.
Contact Zac Wasserman at RE/MAX ONE, your local San Fernando Valley and Ventura County expert.
Find Out What My Home Is WorthPlan My Next Move
Zac Wasserman, REALTOR® | CA DRE# 02210760 | RE/MAX ONE
30699 Russell Ranch Rd #100, Westlake Village, CA 91362
Data source: MLS closed residential sales (single-family, condominium, and townhome) for September 1–30, 2026, retrieved October 7, 2026. Information is deemed reliable but not guaranteed. City figures include only communities with eight or more closed sales. Monthly medians reflect the mix of homes that sold and should not be read as the change in value of any individual property.
- All Posts
- Buyer Guides
- California Home Insurance & Wildfire Risk
- Home Financing (Mortgage & Loan Guides)
- Market Updates & Forecasts
- Seller Guides
- Back
- Ventura County Real Estate Market Updates
- San Fernando Valley Real Estate Market Updates (Monthly): Prices, Inventory & Trends
Ventura County Mortgage Rates October 2026 October 2026 Mortgage Market Update Ventura County Mortgage Rates October 2026: 7.4% and What...
Ventura County Home Seller Guide | Fall / Winter 2026 Should You Sell Now or Wait Until Spring? Ventura County...
SEPTEMBER 2026 · MARKET UPDATE San Fernando Valley Housing Market Update: September 2026 Prices, Trends & City-by-City Data The median...
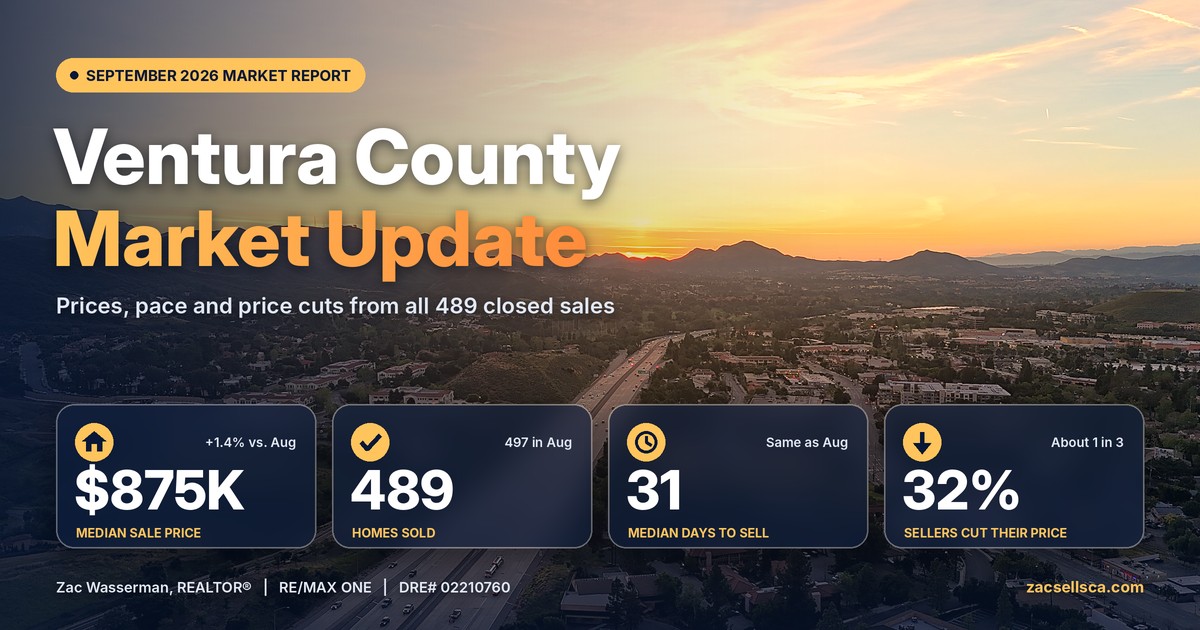
Ventura County’s September 2026 housing market: $875K median price, 489 closed sales, 31 days on market, and city-by-city data for...

State Farm filed to start writing new California home policies again, but only for homes with an IBHS Wildfire Prepared...
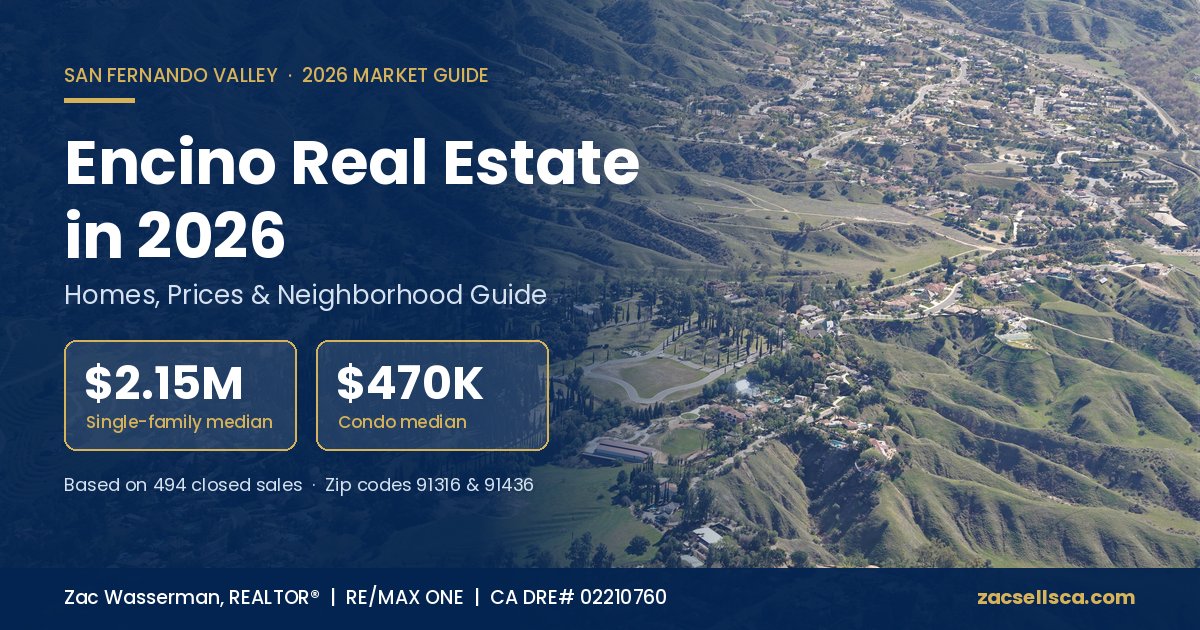
Encino real estate in 2026: see median home and condo prices, 494 closed sales, 91436 vs. 91316 trends, neighborhood insights,...