
Ventura County Mortgage Rates October 2026: 7.4% and What Buyers Should Do
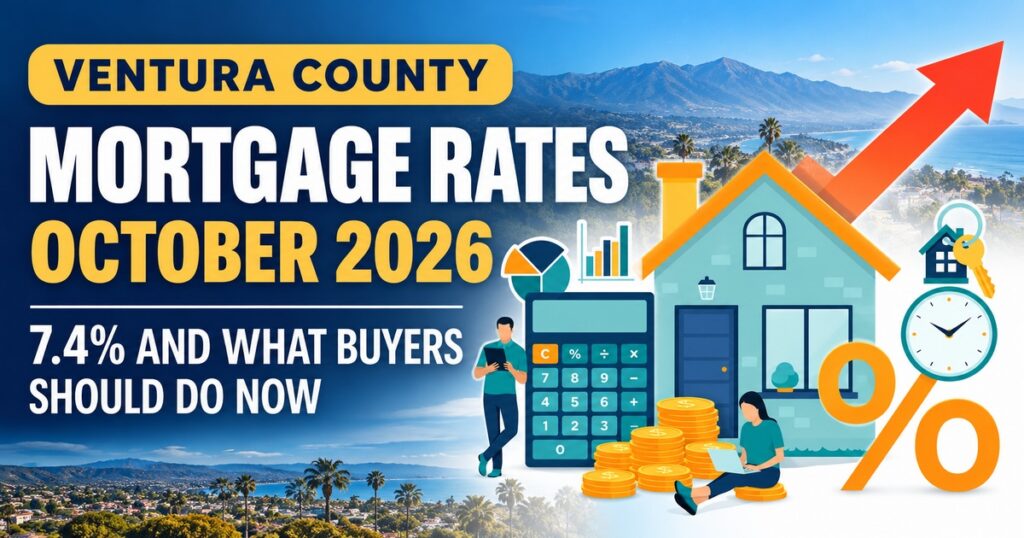
Ventura County Mortgage Rates October 2026 October 2026 Mortgage Market Update Ventura County Mortgage Rates October 2026: 7.4% and What Buyers Should Do Now If you have been watching Ventura County mortgage rates October 2026 headlines this month, you already know the news is not pleasant. The national 30-year fixed rate averaged 7.40% in the week ending October 8, which is the highest reading since late 2023. However, a higher rate does not automatically mean you should stop shopping for a home. Instead, it means you need a sharper plan. In this guide, I break down why rates jumped, what the Fed may do next, what the new rate does to your monthly payment, and five practical moves for buyers in Camarillo, Thousand Oaks, Oxnard, Simi Valley, and the rest of the county. Discuss Your Buying Options → Calculate Your Payment 30-Year Fixed 7.40% October 8, 2026 15-Year Fixed 6.73% National Average Year-Ago Average 6.30% October 2025 Source: Freddie Mac weekly mortgage survey. National averages are not personalized lending quotes. Ventura County Mortgage Rates October 2026: Where We Stand Let’s start with the numbers. According to Freddie Mac‘s weekly survey, the 30-year fixed-rate mortgage averaged 7.40% as of October 8, up from 7.28% the week before and well above the 6.30% average a year ago. Meanwhile, the 15-year fixed averaged 6.73%. As a result, borrowers who qualified comfortably in the summer are now running the numbers all over again. The recent climb has been steady rather than sudden. Rates sat near 6.7% in early September, then moved to 6.95% by September 17. Next, they crossed 7% on September 24 for the first time since January 2025, and they have kept rising since. Therefore, this is not a one-week blip, and buyers should treat it as the new starting point for planning. Important distinction: Freddie Mac’s survey measures a national average for conventional, conforming loans with 20% down and excellent credit. Consequently, your actual quote in Ventura County may be higher or lower depending on your credit score, down payment, loan type, and whether you need a jumbo loan. If you want the previous month’s snapshot for comparison, you can read my September 2026 Ventura County mortgage rate update. Why Mortgage Rates Jumped Above 7% Mortgage rates do not follow the Fed’s policy rate directly. Instead, they track longer-term borrowing costs, especially the 10-year Treasury yield. Therefore, anything that pushes inflation expectations higher tends to push mortgage rates up as well. Several forces have combined this fall. First, energy prices have stayed elevated during the ongoing conflict with Iran, and that has kept inflation worries alive. Second, the Federal Reserve raised its target range by 0.25 percentage points on September 16, to 3.75%–4.00%. That was the first hike since July 2023. Additionally, Fed officials signaled that another increase is likely before year-end. For a deeper look at that decision, see my breakdown of what the September Fed rate hike means for Ventura County and LA buyers. Why This Matters for Homebuyers In short, lenders are pricing in a world where inflation stays stubborn and rates stay higher for longer. Because of that, even good economic news can nudge mortgage rates upward. What the Fed Does Next: Dates to Watch Buyers who are tracking rates should circle three dates. First, September’s Consumer Price Index report arrives on October 14. Second, Freddie Mac releases its next weekly rate survey on October 15. Finally, the Fed announces its next policy decision on October 28. OCT 14 Inflation Report September CPI OCT 15 Freddie Mac Weekly Rate Survey OCT 28 Federal Reserve Policy Decision Markets currently expect the Fed to hold steady in October, with traders pricing only about a 20% to 25% chance of a hike at that meeting. However, many analysts still expect another increase in December. As a result, a hot inflation report could push mortgage rates higher before the October meeting, while a soft report could give them some relief. Nobody can time this perfectly, and that is exactly why I recommend building a plan that works at today’s rate instead of a hoped-for rate. You can follow the official schedule on the Federal Reserve’s FOMC calendar. What 7.4% Does to Your Monthly Payment Numbers make the impact easier to see. The table below shows the principal-and-interest payment on a 30-year fixed loan at three recent rate levels. I used 20% down on three example home prices of $750,000, $1,000,000, and $1,200,000, which produce loan amounts of $600,000, $800,000, and $960,000. These are illustrative examples, not Ventura County medians. Loan Amount At 6.30% A Year Ago At 6.69% Early August At 7.40% October 2026 Monthly Increase vs. A Year Ago $600,000 $3,714 $3,868 $4,154 +$440/month $800,000 $4,952 $5,157 $5,539 +$587/month $960,000 $5,942 $6,188 $6,647 +$705/month On smaller screens, swipe horizontally to view the complete table. Payments are rounded estimates for principal and interest only, assuming a 30-year fixed-rate loan. Payment Difference $587 More Per Month On an $800,000 loan, the estimated monthly principal-and-interest payment rises from $4,952 at 6.30% to $5,539 at 7.40%. Notice that these figures exclude property taxes, homeowners insurance, and any HOA dues. Moreover, insurance costs have risen across California, so your real monthly housing cost will be higher than the table shows. To see how this changes your own budget, try the Ventura County mortgage calculator or read my guide on how much house you can afford in Ventura County. Ventura County Homebuyers Wondering What You Can Actually Afford? Higher mortgage rates don’t have to leave you guessing. Let’s discuss your budget, target neighborhoods, and opportunities to negotiate better purchase terms in Ventura County. Let’s Build Your Buying Strategy → Zac Wasserman | REALTOR® | RE/MAX ONE 5 Smart Moves for Ventura County Buyers Right Now Higher rates change the strategy, but they do not end the opportunity. Here is what I suggest. MOVE 01 Get Fully Pre-Approved and Compare Multiple Lenders Rate quotes can vary meaningfully from one lender to the next. Therefore, request at
Should You Sell Now or Wait Until Spring? Ventura County Fall/Winter 2026 Guide
Ventura County Home Seller Guide | Fall / Winter 2026 Should You Sell Now or Wait Until Spring? Ventura County Fall/Winter 2026 Guide By Zac Wasserman, REALTOR® (CA DRE# 02210760), RE/MAX ONE | Updated October 9, 2026 If you own a home in Ventura County and you’ve been thinking about listing, you’re probably asking one question: should you sell now or wait until spring? It’s a fair question, because the market changed this fall. Mortgage rates climbed to 7.40% in early October. The Federal Reserve raised rates for the first time since 2023, and the holidays are only a few weeks away. However, the local numbers tell a more useful story than the headlines do. In this guide, I’ll walk through what September’s MLS data shows and what each choice is likely to cost you. I’ll also explain how to decide based on your own situation. Should You Sell Now or Wait Until Spring? The Short Answer For most Ventura County homeowners, selling this fall makes sense if you need to move within the next six months. It also makes sense if you’re buying another home in the same market or if your home is ready to show today. On the other hand, waiting makes sense if your home needs work and your timeline is flexible. You should also be able to carry the home comfortably through winter. Therefore, the right answer depends less on the calendar and more on your price, your preparation, and your next move. Free Home Valuation → One thing is clear from the data, though: timing matters far less than pricing. In September, homes that were priced correctly sold in a median of 20 days at full price. Meanwhile, homes that needed a price reduction took a median of 70 days. As a result, a well-priced November listing can outperform an overpriced April listing. What the Ventura County Market Looks Like Heading Into Winter I pulled every closed sale in the county for September, and the full breakdown is in my September 2026 Ventura County market update. Here are the numbers that matter most for sellers: Closed sales: 489, compared with 497 in August Median sale price: $875,000 across all property types, and $950,000 for single-family homes Median days on market: 31 Median sale-to-list price ratio: 98.6%, down slightly from 99% in August Sellers who reduced their price before selling: 32% Sellers who paid a credit toward the buyer’s closing costs: 39%, with a median credit of $7,750 In other words, the market is steady but no longer forgiving. Prices are holding, and homes are still selling in about a month. However, roughly one in three sellers had to cut their price. In addition, nearly four in ten paid part of the buyer’s costs. Furthermore, most of those September closings went under contract in August, before rates jumped. Consequently, I expect the October and November data to show somewhat longer market times and more negotiation. How 7.40% Mortgage Rates Change the Math for Sellers According to Freddie Mac’s Primary Mortgage Market Survey, the average 30-year fixed rate reached 7.40% on October 8, 2026. That is up from 7.28% a week earlier and 6.30% a year ago. In addition, the September Fed rate hike lifted the federal funds range to 3.75%–4.00%, and several Fed officials have signaled that one more increase is possible before year-end. You can check upcoming meeting dates on the Federal Reserve’s FOMC calendar. So what does that mean for your buyer? For example, consider someone purchasing the county’s median-priced home at $875,000 with 20% down. At 6.30%, the principal and interest payment on a $700,000 loan is about $4,333 a month. At 7.40%, that same payment is about $4,847. Therefore, today’s buyer pays roughly $514 more every month than a buyer did a year ago for the same house. Because of that, buyers are more payment-sensitive than they were last spring. They negotiate harder, they ask for credits, and they walk away from homes that feel overpriced. Still, the buyers who are shopping right now are serious, because nobody tours homes at 7.40% for fun. Many of them have a job relocation, a lease ending, or a home they’ve already sold. It’s also worth being honest about what nobody knows. Rates could ease by next year if inflation cools. Alternatively, they could move higher if the Fed raises again. For that reason, waiting for a better rate environment is a bet, not a plan. The Case for Selling Now First, you’ll typically face less competition. Many homeowners delay listing once the holidays approach. As a result, the buyers who are still looking have fewer homes to choose from. A clean, well-priced home stands out. Second, you stop the clock on carrying costs. Every month you wait, you keep paying the mortgage, property taxes, insurance, and maintenance. For example, those costs might total $5,000 a month on your home. If so, waiting from November to April costs about $25,000 before you ever accept an offer. Your number will differ, so run it with your own bills. Third, if you’re also buying, the same conditions work in your favor on the purchase. In September, 39% of sellers paid a buyer credit and 32% cut their price. As a result, you’ll likely have room to negotiate on your next home. In fact, selling and buying in the same market often cancels out much of the timing risk. Finally, you avoid the uncertainty. Today’s prices are known: the county median is $875,000. In addition, well-priced homes are selling at full price in about three weeks. Next year’s prices and rates, however, are only a forecast. If you’re worried about where things are headed, I covered the longer outlook in my post on a possible housing market crash in 2027. The Case for Waiting Until Spring Waiting is a perfectly reasonable choice for some sellers, and I’d rather tell you that than push you to list. First, the spring market usually brings more buyers. Families often
San Fernando Valley Housing Market Update: September 2026 Prices, Trends & City-by-City Data
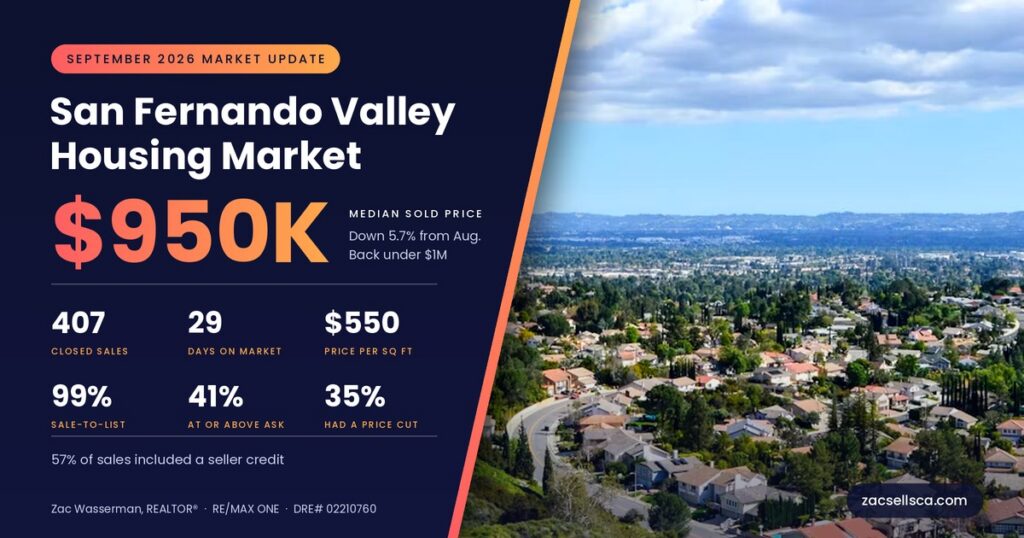
SEPTEMBER 2026 · MARKET UPDATE San Fernando Valley Housing Market Update: September 2026 Prices, Trends & City-by-City Data The median slipped under $1 million, but single-family prices moved just 1.1%. Here is what actually changed. Get My Free Home Valuation By Zac Wasserman, REALTOR® (CA DRE# 02210760), RE/MAX ONE. Published October 7, 2026. Based on 407 closed residential sales recorded in the MLS for September 1–30, 2026. The San Fernando Valley housing market crossed a line in September that people will notice: the median sold price slipped back under $1 million. However, the headline hides more than it reveals. Single-family prices barely moved, condo and townhome prices actually rose, and the real change is happening at the top of the market and in how long homes sit. Below, I break down what closed, what it sold for, and what it means for your next move. In this update:At a Glance|Median Price|Days on Market|Prices by City|Condos & Townhomes|Mortgage Rates|For Sellers|For Buyers|FAQ San Fernando Valley Housing Market at a Glance: September 2026 The median sold price in the San Fernando Valley was $950,000 in September 2026, based on 407 closed sales. Homes took a median of 29 days to sell and closed at roughly 99% of their final list price. Here are the Valley-wide numbers for the month: Closed sales: 407 (down from 446 in August) Median sold price, all homes: $950,000 (down from $1,007,500) Median price per square foot: $550 Median days on market: 29 (August: 28) Median sale-to-list ratio: 99% Sold at or above asking: 41% (August: 44%) Sold after at least one price cut: 35% Sales with a seller concession: 57% In short, fewer homes closed, the middle price came down, and buyers negotiated on more than half of all deals. Even so, speed held steady, which tells me demand is still there for homes that are priced correctly. For a side-by-side look, you can compare these figures with August's San Fernando Valley numbers. San Fernando Valley Median Home Price: Why It Slipped Below $1 Million A 5.7% one-month drop in the median sounds dramatic. However, it does not mean your home lost 5.7% of its value in thirty days, and here is why. First, look at single-family homes on their own. The median single-family sale was $1,170,000 in September, compared with $1,182,500 in August. That is a 1.1% move, which is ordinary month-to-month noise. Similarly, the median price per square foot for houses eased from $609 to $597. Second, look at what closed. Three of the Valley's most expensive communities posted much lower medians than the month before, because a different mix of homes sold there: Encino: $1,525,000 (August: $2,050,000) Studio City: $1,474,500 (August: $1,900,500) Calabasas: $1,550,000 (August: $1,911,500) As a result, the Valley-wide median was pulled down by fewer high-end closings in those areas, while most mid-priced neighborhoods held flat or rose. In other words, this was a mix shift far more than a price cut across the board. That said, the luxury tier still closed deals. Forty-six homes sold for $2 million or more, and nine closed above $5 million, led by a $12,000,000 sale in Encino. Meanwhile, 54% of all September sales closed under $1 million, which is where most of the buyer activity lives right now. How Fast Are Homes Selling? Days on Market and Price Cuts Speed is where this market splits in two. Overall, the median home sold in 29 days. However, that single number blends two very different experiences. On one hand, 27% of homes went under contract within two weeks. On the other hand, another 27% sat for more than 60 days. Therefore, a seller's outcome depends heavily on which group the home lands in, and pricing is what decides it. The data makes this point clearly. Homes that sold without a price reduction took a median of 19 days. Homes that needed a reduction took a median of 67 days, and the typical cut was about $50,000, or 5.6% of the original asking price. Consequently, overpricing by 5% cost those sellers roughly seven extra weeks and usually the same money in the end. Concessions matter too. In 57% of September sales, the seller contributed toward the buyer's costs, with a median credit of $26,000, or about 2.5% of the sale price. Because of that, the true net for many sellers is lower than the recorded sale price suggests. For example, a home that closed at "99% of list" with a 2.5% credit effectively sold closer to 96.5%. Finally, attached homes moved more slowly than houses. Single-family homes sold in a median of about 27 days, while condos took 38 days and townhomes took 47. San Fernando Valley Home Prices by City The table below covers every Valley community with at least eight closed sales in September. Smaller samples can swing sharply from month to month, so treat cities with fewer than 20 sales as directional. San Fernando Valley home prices by city, September 2026 City Sales Median Sold Price Median $/Sq Ft Median Days on Market Sale-to-List Sold After a Price Cut Calabasas 17 $1,550,000 $590 45 98% 47% Encino 50 $1,525,000 $628 24 98% 32% Studio City 24 $1,474,500 $676 25 97% 17% Sherman Oaks 43 $1,399,000 $683 29 98% 30% Tarzana 12 $1,337,500 $523 29 97% 25% Woodland Hills 59 $1,175,000 $572 27 98% 32% West Hills 29 $1,070,000 $516 23 99% 31% Lake Balboa 8 $902,000 $482 21 100% 25% Northridge 25 $875,000 $495 36 100% 60% Chatsworth 24 $856,000 $452 43 99% 50% North Hollywood 31 $845,000 $564 32 99% 58% Winnetka 18 $827,500 $441 34 99% 33% Reseda 14 $826,500 $505 28 100% 36% Canoga Park 17 $815,000 $504 36 99% 24% Van Nuys 24 $811,000 $490 47 100% 17% Panorama City 10 $730,000 $477 22 102% 30% A few patterns stand out. The entry-level Valley is the competitive Valley. Panorama City sold at a median of 102% of list, and 80% of its sales closed at or above asking. Likewise, about 85%
Ventura County Real Estate Market Update: September 2026
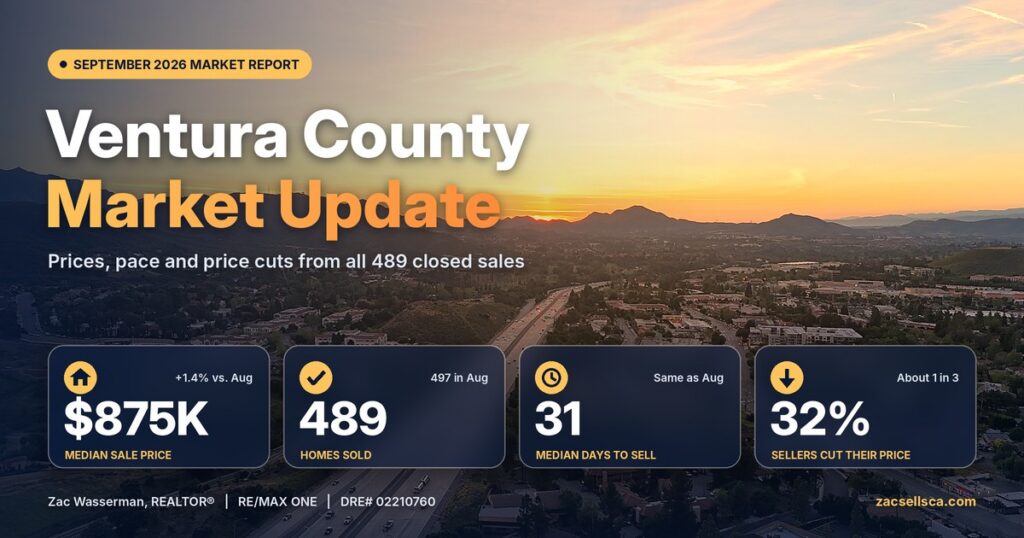
Ventura County’s September 2026 housing market: $875K median price, 489 closed sales, 31 days on market, and city-by-city data for buyers and sellers.
State Farm New Policies in California (2026): Who Qualifies & What Ventura County Homeowners Should Do

State Farm filed to start writing new California home policies again, but only for homes with an IBHS Wildfire Prepared Home designation. Here’s who qualifies, why you shouldn’t drop the FAIR Plan yet, and what Ventura County homeowners, buyers and sellers should do now.
Encino Real Estate in 2026: Homes, Prices & Neighborhood Guide

Encino real estate in 2026: see median home and condo prices, 494 closed sales, 91436 vs. 91316 trends, neighborhood insights, and tips for buyers and sellers.
Sherman Oaks Real Estate in 2026: Homes, Prices & What Buyers Should Know

Sherman Oaks real estate in 2026 shows a $1.688M median for single-family homes and $655K for condos and townhomes. See prices by ZIP code, days on market, seller concessions, and where buyers may still have negotiating room.
Will the Housing Market Crash in 2027? An Honest Ventura County Forecast
Will the housing market crash in 2027? After the Fed’s September hike, see what Ventura County prices, inventory and foreclosures say about next year.
The Fed Just Raised Rates: What the September 2026 Hike Means for Ventura County & LA Buyers

Ventura County & Los Angeles Real Estate What the September 2026 Fed Rate Hike Means for Ventura County & LA Buyers The Federal Reserve just raised rates for the first time since 2023. Here is what that change means for mortgage rates, buying power, sellers, and your next real estate move. Get a Free Home Valuation Fed Rate Hike & CA Mortgage Rates (2026) On September 16, 2026, the Federal Reserve did something it had not done in more than three years: it raised interest rates. This September 2026 Fed rate hike moved the federal funds target range up 25 basis points to 3.75%–4.00% — the first increase since 2023. If you are buying or selling a home in Ventura County or the greater Los Angeles area, you are probably wondering what this Fed rate hike in 2026 means for mortgage rates, your buying power, and your timing. As a local REALTOR®, I want to cut through the headlines and explain exactly what changed, why it happened, and what you should do next. The Quick Take The Fed does not directly set mortgage rates. However, the September rate increase changes the broader interest-rate outlook and makes waiting for dramatically lower borrowing costs a less certain strategy. Buyers should focus on payment, negotiation, and financing options, while sellers should pay especially close attention to pricing and presentation. What the Fed Rate Hike in September 2026 Actually Did First, let’s be precise about what happened. The Federal Open Market Committee voted 12–0 to raise its benchmark rate by a quarter of a percentage point. As a result, the federal funds rate now sits in a range of 3.75% to 4.00%. Additionally, the Fed’s post-meeting statement noted that inflation “remains elevated,” driven largely by a spike in oil prices and related cost pressures. This is a meaningful shift. For most of the past two years, the story was about cuts — when would the Fed start lowering rates. However, that narrative has now reversed. Because inflation reaccelerated, the Fed chose to tighten instead of ease. You can read the official Sept 16, 2026 FOMC policy statement directly if you want the full language, but the takeaway is simple: the era of “waiting for cuts” is on hold. Does a Fed Rate Hike Directly Raise Mortgage Rates? Here is the part that surprises many buyers. The Fed does not set mortgage rates directly. The federal funds rate is an overnight lending rate between banks, while 30-year mortgage rates track the bond market — specifically the 10-year Treasury yield and mortgage-backed securities. Therefore, a Fed rate hike does not automatically add a matching amount to your home loan. That said, the two are deeply connected. When the Fed signals that it will keep rates “higher for longer,” bond investors price that in, and mortgage rates tend to drift upward as a result. Furthermore, the September dot plot showed most officials now expect the benchmark rate to end 2026 between roughly 4.1% and 4.4% — higher than they projected just a few months earlier. Consequently, mortgage rates have been nudging up rather than down. For the current week-by-week picture, Freddie Mac’s Primary Mortgage Market Survey is the number I watch most closely, and it is worth checking before you lock. What the Fed Rate Hike Means for Ventura County & LA Mortgage Rates So what does this mean locally? In practical terms, financing a home here just got a little more expensive, and the “wait for rates to drop” strategy carries more risk than it did a few months ago. For a detailed look at where local rates stand right now, I keep my post on Ventura County mortgage rates updated regularly. Because home prices in Ventura County and Los Angeles are high to begin with, even a small rate move changes your monthly payment noticeably. For example, on a $750,000 loan, a half-point increase in your rate adds roughly $220 a month — about $2,600 a year. As a result, understanding your true budget matters more than ever. If you have not run the numbers recently, my guide on how much house can I afford in Ventura County walks through payment examples at different rate levels. Why small rate changes matter here In a high-cost market such as Ventura County or Los Angeles, a seemingly small change in the interest rate can translate into hundreds of dollars in monthly payment. That makes financing strategy just as important as purchase price. What This Means for Buyers Right Now If you are a buyer, this Fed rate hike in 2026 does not have to derail your plans — but it should sharpen them. First, get fully underwritten (not just pre-qualified) so you know your real number in this rate environment. Next, ask your lender about strategies that soften a higher rate, such as a temporary buydown or a seller-paid rate buydown negotiated into your offer. Additionally, adjustable-rate mortgages are worth a fresh look, since they can price meaningfully below a 30-year fixed while the Fed holds rates elevated. Meanwhile, keep in mind that higher rates cool competition. Because some buyers step back when rates rise, you may face fewer bidding wars and gain more negotiating room on price and credits. In other words, a higher rate on a home you negotiated well can beat a lower rate on a home you overpaid for. Still wrestling with the timing question? My honest take on should you wait to buy a house in 2026 is a good next read. What This Means for Sellers in Ventura County & LA Sellers, do not panic — but do adjust expectations. Because higher mortgage rates trim buyer purchasing power, demand softens at the margins, and slightly overpriced homes sit longer. Therefore, pricing correctly from day one matters more in this environment than it did during the frenzy. Homes priced right and shown well still sell; homes priced on last year’s comps tend to stall and then chase the market down. Additionally,
Boyle Heights Real Estate Guide 2026: Homes, Prices & What Buyers Should Know
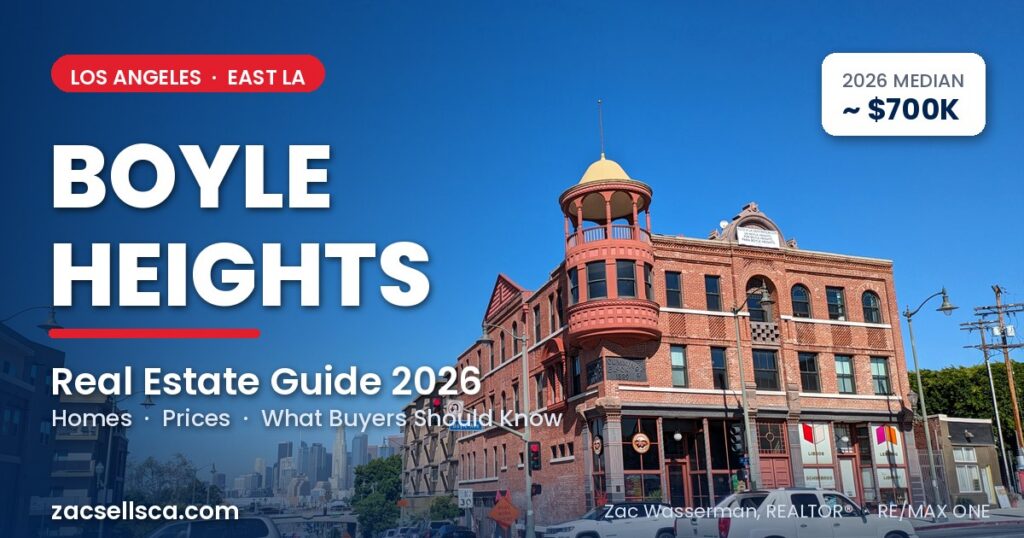
East Los Angeles Real Estate Guide • 2026 Boyle Heights Real Estate Guide 2026: Homes, Prices & What Buyers Should Know Current prices, housing styles, Metro access, schools, neighborhood trade-offs, and a block-by-block buying strategy for one of East LA’s most distinctive communities. Boyle Heights Real Estate Guide 2026 If you have been priced out of Echo Park, Highland Park, or Silver Lake, Boyle Heights real estate has probably landed on your radar — and for good reason. This East LA neighborhood sits just across the Los Angeles River from Downtown, carries one of the deepest cultural identities in the city, and still prices well below the citywide median. As a Southern California REALTOR® who covers LA’s east-side neighborhoods closely, I want to give you the honest, data-grounded picture that the listing portals usually skip. Therefore, this guide walks through 2026 prices, home styles, transit, schools, and exactly who this neighborhood fits. Quick Take Boyle Heights offers a lower entry price than many nearby LA neighborhoods, strong transit access, a deep cultural identity, and unusually meaningful multifamily inventory. The trade-off is that buyers need to evaluate older housing stock, freeway proximity, and block-by-block pricing carefully. Boyle Heights Real Estate at a Glance in 2026 Boyle Heights is a roughly six-square-mile, working-class neighborhood of about 84,000 people, bounded by the LA River and Downtown to the west and East Los Angeles to the east. Historically, it was one of the most multiethnic corners of the city — home to Jewish, Japanese, Russian, and Mexican communities — and today it is a predominantly Mexican-American cultural anchor. As a result, you get landmarks like Mariachi Plaza, the El Mercado marketplace, and a food scene that regularly ranks among the most authentic in Los Angeles. For buyers, the headline is affordability plus access. Home values sit well under the LA city median, yet Downtown is about two miles away and the Metro E Line runs straight through the neighborhood. Consequently, Boyle Heights real estate attracts a mix of first-time buyers, investors, and creatives who want proximity to Downtown without a Downtown price tag. 2026 Median Range Low–Mid $700Ks Transit Metro E Line Best Known For Culture + Access Boyle Heights Home Prices & Market Trends in 2026 So what do homes actually cost? By most 2026 readings, the median sits in the low-to-mid $700,000s, although the exact figure depends on which source you trust. Redfin has recently pegged the median sale price near $715,000, while Homes.com reported a June 2026 median close to $750,000. Zillow’s home value index, on the other hand, reads lower — around $644,000 — and shows values down roughly 2.6% year over year. Price per square foot generally lands between the high-$400s and low-$600s, again depending on the source and the home’s condition. For context, the Los Angeles citywide median hovers around $1.15 million. Therefore, Boyle Heights buyers are typically paying somewhere between half and two-thirds of the city median — a meaningful discount for a neighborhood this close to the urban core. Additionally, homes here tend to sit a bit longer than the LA average, often around 85 to 89 days on market, which gives prepared buyers real negotiating room. If you want to translate these numbers into a monthly payment, my guide on how much house can I afford in Los Angeles breaks down the math by price band. Buyer note: A neighborhood median is useful for orientation, but it is not a substitute for current, property-specific comparable sales. Condition, lot size, unit count, parking, renovations, and even a few blocks of location can materially change value. Why Boyle Heights Real Estate Medians Don’t Agree (And What Buyers Should Do) Here is something most guides won’t tell you: the “median” you see for Boyle Heights real estate can swing by more than $100,000 depending on the site. Redfin, Realtor.com, Zillow, and Movoto all calculate slightly differently, and each is measuring a different pool — sold homes versus active listings versus algorithmic estimates. As a result, one source may show $625,000 while another shows $750,000 for the same month. That gap is not noise, and it matters for your offer. Practically speaking, it tells you the sold pool and the active listing pool are not lining up cleanly, which is exactly why you should never anchor to a single median and stop. Instead, the smarter question is not “what is Boyle Heights worth?” but “what is this block, in this condition, with this footprint worth?” Boyle Heights is not one flat market — buyers are really shopping micro-pockets, and each pocket behaves a little differently. Consequently, a renovated home priced near the high median needs a stronger comp story than a dated bungalow priced near the low one. This is where a local agent earns their keep: I read the live comps block by block rather than trusting a ZIP-code average. What You Get: Home Styles & Housing Stock Boyle Heights offers more architectural variety than you might expect. You will find classic California bungalows, Spanish-style homes, Craftsman cottages, and even the occasional Victorian, laid out on tight grid-style blocks of small lots. Renovated two-story homes and newer builds often run from the low $700,000s into the $1 million-plus range, while smaller bungalows can start in the mid-$300,000s to low $700,000s depending on condition. One feature that sets this neighborhood apart is the density of multifamily property. In a typical month, there are far more multi-family units for sale than single-family homes. For investors and house-hackers, that is a genuine opportunity — you can live in one unit and rent the others, which is much harder to pull off in pricier east-side neighborhoods. If you are weighing Boyle Heights against other LA options, my roundup of the best neighborhoods in Los Angeles County puts the trade-offs side by side. Want to compare a Boyle Heights listing against the right local comps? Send me the address. I can help you look beyond portal estimates and evaluate the property block
Koreatown Real Estate in 2026: Homes, Condos & What Buyers Should Know
Koreatown Real Estate in 2026: Homes, Condos & What Buyers Should Know 2026 Los Angeles Buyer Guide Koreatown Real Estate in 2026: Homes, Condos & What Buyers Should Know A practical look at Koreatown prices, condos, homes, lifestyle, neighborhoods, and what Los Angeles buyers should understand before making an offer. Few Los Angeles neighborhoods pack as much energy into a single square mile as Koreatown. If you are researching Koreatown real estate in 2026, you have probably already noticed the contrast: pre-war courtyard buildings sitting beside glassy high-rises, 24-hour restaurants, and some of the most walkable blocks in the city. As a licensed REALTOR® serving Los Angeles and Ventura County, I get asked about K-Town constantly, and for good reason. It remains one of the few central LA neighborhoods where buyers can still find condos under seven figures with genuine upside. However, buying here is not as simple as picking a listing you like. The Koreatown market rewards buyers who understand the building types, the pockets, and the quirks of a neighborhood that shifts block by block. Therefore, this guide walks you through everything you need: current prices, condos versus homes, what daily life actually feels like, and how to make a smart offer in 2026. Thinking about buying in Koreatown? I can help you compare buildings, HOA costs, recent comparable sales, and individual blocks before you commit. Talk With Zac Why Koreatown Is One of LA’s Most Talked-About Neighborhoods Koreatown sits just west of Downtown Los Angeles, bounded loosely by Beverly Boulevard, Pico, Vermont, and Western. Additionally, it is one of the densest neighborhoods in the entire country, which explains the wall-to-wall energy. You get nightlife, spas, karaoke, and world-class food within steps of your front door, all at a scale that genuinely surprises first-time visitors. For buyers, that density is the whole appeal. Because so much is packed into so little space, Koreatown consistently ranks among the most walkable and transit-connected areas in LA. The Metro B and D (Purple) Line stations at Wilshire/Vermont and Wilshire/Western put Downtown, Hollywood, and eventually the Westside within an easy ride, and the Metro D Line extension is steadily widening that reach. As a result, many buyers here happily skip the second car, which is rare in car-dependent Los Angeles. Furthermore, the neighborhood draws a mix of young professionals, creatives, and long-term investors. That diversity keeps demand steady across price points, from entry-level condos to renovated Spanish-style income properties. If you are weighing K-Town against other central options, my guide to the best neighborhoods in Los Angeles County puts it in context alongside the rest of the city. The Koreatown Real Estate Market in 2026: Prices & Trends Let’s talk numbers, because this is where things get interesting. The neighborhood is overwhelmingly a condo and multifamily market rather than a single-family one. Consequently, “median price” here depends heavily on what type of property you are looking at, and a single headline figure can be misleading. 2026 Pricing Snapshot Rule of thumb: Koreatown is a condo-first market, so the right comparison is price per square foot plus monthly HOA — not the headline list price. Budget for both before you tour. In 2026, most condos in Koreatown trade in a broad range from the mid $400,000s for smaller or older units up to $900,000 and beyond for renovated two-bedrooms in newer buildings. Meanwhile, the rare single-family homes and small income properties, often historic Spanish or Craftsman builds, can list anywhere from $1.1 million to well over $2 million depending on lot size and condition. On a price-per-square-foot basis, K-Town still tends to undercut much of the Westside, which is exactly why value-focused buyers keep circling back to it. Inventory remains tighter than buyers would like, however, and well-priced units still move quickly. Additionally, HOA dues matter enormously here. A luxury high-rise with a pool, gym, and concierge can carry dues of $600 to $1,000 per month, while a smaller vintage building may run a fraction of that. Therefore, I always tell clients to underwrite the monthly HOA as seriously as the purchase price itself. For current sold data, I cross-reference the MLS against public sources like Zillow’s Koreatown market data so my clients see the full picture, not just active listings. Koreatown Condos vs. Homes: What You Can Actually Buy Because inventory skews so heavily toward attached housing, most buyers here are choosing among a few distinct building types. Understanding them upfront saves you a lot of wasted showings and false starts. Luxury high-rises: Primarily along Wilshire Boulevard, offering amenities, security, and skyline views, but generally carrying the highest HOA dues and price per square foot. Mid-century and 1980s mid-rise condos: A large share of Koreatown inventory and often a strong value option, although buyers should inspect aging plumbing and electrical systems carefully. Converted vintage buildings and small-lot single-family homes: Less common and often competitive when they come to market at an attractive price. For first-time buyers especially, the math matters more than the marketing. Before you fall in love with a high-rise, it is worth running the full monthly picture, including HOA and taxes, against your budget. My Los Angeles home affordability guide is a good place to pressure-test your numbers before you start touring, since the payment on a $700,000 condo with high dues can rival a much pricier home elsewhere. The HOA payment can change the entire affordability equation. When comparing Koreatown condos, look beyond the list price. Monthly dues, insurance, reserves, upcoming assessments, parking, and building condition can materially change what a property really costs to own. What It’s Like Living in Koreatown Numbers only tell half the story, so let’s talk about daily life. Living in Koreatown means trading square footage and a private yard for convenience, culture, and walkability that almost no other LA neighborhood can match. On the plus side, you are surrounded by extraordinary food, late-night options, grocery stores, gyms, and nightlife, most of it walkable from your door. Public transit is genuinely usable
Port Hueneme Investment Properties in 2026: NNN, Owner-Financed & Commercial Real Estate

Explore Port Hueneme investment properties in 2026, from multifamily and NNN opportunities to owner-financed and commercial real estate near the port.
Ventura County Mortgage Rates: September 2026 Update
Ventura County mortgage rates are near a one-year high in September 2026. See current 30-year, 15-year, and ARM rates, real local payment examples, and what buyers and sellers should consider right now.
Can You Sell an ADU Separately in California? Your 2026 AB 1033

Can You Sell an ADU Separately in California? Your 2026 AB 1033 Guide for LA & Ventura County Sell an ADU Separately in California (AB 1033) If you built a backyard unit to add income or house family, you have probably wondered whether you can sell an ADU separately from your main home and cash in on that equity. It is one of the most common questions I hear from homeowners across Ventura County and the San Fernando Valley, and the honest 2026 answer has real nuance. A California law called AB 1033 made separate sales possible in theory. However, whether it applies to your property depends entirely on where you live. In this guide, I will walk you through exactly what AB 1033 does, where it stands locally right now, and how to position yourself if your city eventually opts in. I am Zac Wasserman, a licensed REALTOR with RE/MAX ONE, and I help buyers and sellers navigate exactly these kinds of gray areas every week. Let’s clear up the confusion. What AB 1033 Actually Does (and What It Doesn’t) Assembly Bill 1033 was signed into law in October 2023 and took effect on January 1, 2024. In plain terms, it added a new section to California’s planning code that gives cities and counties the authority to let homeowners sell an accessory dwelling unit as its own condominium, separate from the primary house on the same lot. Before this law, an ADU was legally tied to the main home and could not be sold on its own. Here is the catch that trips up most homeowners, though. AB 1033 is permissive, not mandatory. In other words, the state did not automatically unlock separate ADU sales everywhere. Instead, each individual city or county must affirmatively pass its own local ordinance before any homeowner in that jurisdiction can take advantage of the law. As a result, the map of where this actually works is patchy, and it is changing slowly. Additionally, it helps to understand what the law does not do. AB 1033 does not create new types of ADUs, loosen construction rules, or override your local zoning. Furthermore, it does not turn your existing rental unit into an instant sellable asset. It simply changes what can legally happen to a permitted ADU after it is built, and only in places that have opted in. The key distinction California allows local governments to create an AB 1033 program. The law does not automatically give every California homeowner the right to sell an ADU separately. Can You Sell an ADU Separately in California Right Now? For most of the state, the short answer is still no. As of 2026, only a small number of California jurisdictions have adopted the local ordinance required for a separate ADU sale. San Jose led the way and completed the state’s first separate ADU sale in 2025. Santa Monica followed with its own ordinance, and unincorporated San Diego County adopted a program that took effect in April 2026. A few other cities are studying or drafting ordinances, but the list of places where this is fully operational remains short. Consequently, whether this option is even available to you comes down to one question: has your specific city or county opted in? If the answer is no, then under default state law your ADU still cannot be sold apart from the main house, no matter how nice or independent the unit is. This is why I always tell homeowners to confirm their local status before making any decision based on AB 1033. AB 1033 Status in Los Angeles and Ventura County (2026) Now for the part that matters most to my clients. As of 2026, neither Los Angeles nor Ventura County allows the separate sale of an ADU. Let’s break it down by area. Ventura County In Ventura County, the county updated its ADU ordinance in 2024 to align with state law, and it applies to all unincorporated areas through the Resource Management Agency. However, that ordinance does not implement an AB 1033 separate-sale program. Moreover, none of the county’s ten incorporated cities, including Thousand Oaks, Camarillo, Simi Valley, Oxnard, and Ventura, has adopted its own AB 1033 ordinance yet. Therefore, if you own an ADU anywhere in Ventura County today, you cannot sell it separately from your primary residence. Los Angeles The picture is similar in Los Angeles. The City of Los Angeles introduced a council motion back in 2025 to explore AB 1033, but that motion has not advanced into an adopted ordinance. Likewise, unincorporated Los Angeles County has not adopted a separate-sale program, and neighboring cities such as Pasadena, Glendale, and Alhambra remain on the sidelines as well. In short, the entire LA-to-Ventura corridor that I serve is currently a “not yet” zone. That said, local policy can shift quickly, and housing pressure keeps AB 1033 on the agenda. For that reason, it is worth understanding how the process would work so you are ready to move the moment your city acts. Your ADU may not be separately sellable yet — but it can still affect what your property is worth today. If you own a home with an ADU in Ventura County or the San Fernando Valley, I can help you look at the property as a whole and understand how buyers may value the additional living space and income potential. Get a Free Home Valuation Call or Text 805.212.9147 How the ADU Condo Conversion Process Works Selling an ADU separately is not as simple as listing it and finding a buyer. Because the law treats the ADU as a condominium, you essentially convert your single lot into a two-unit condo project. Here is the general path in jurisdictions that allow it. 1 The ADU must be fully permitted and have received its certificate of occupancy. 2 A surveyor and civil engineer prepare the required condominium mapping. 3 A condominium plan is recorded and separate ownership interests are created. 4 CC&Rs are recorded
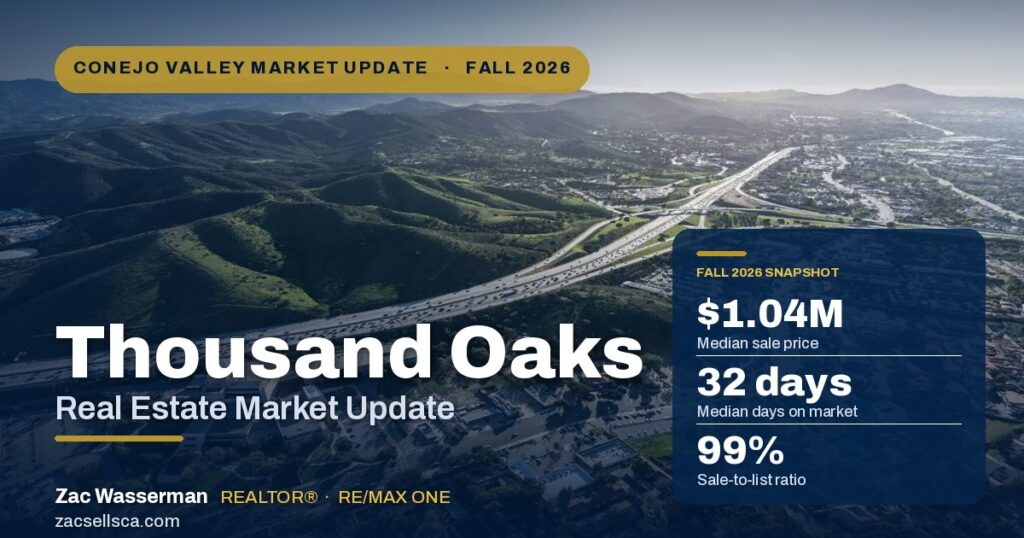
Thousand Oaks Real Estate Market Update: Fall 2026
Can you sell an ADU separately in California under AB 1033? See the 2026 status for Ventura County and Los Angeles, plus costs, financing, and how homeowners can prepare.