
What Is My Home Worth in Camarillo? (2026 Seller Guide)
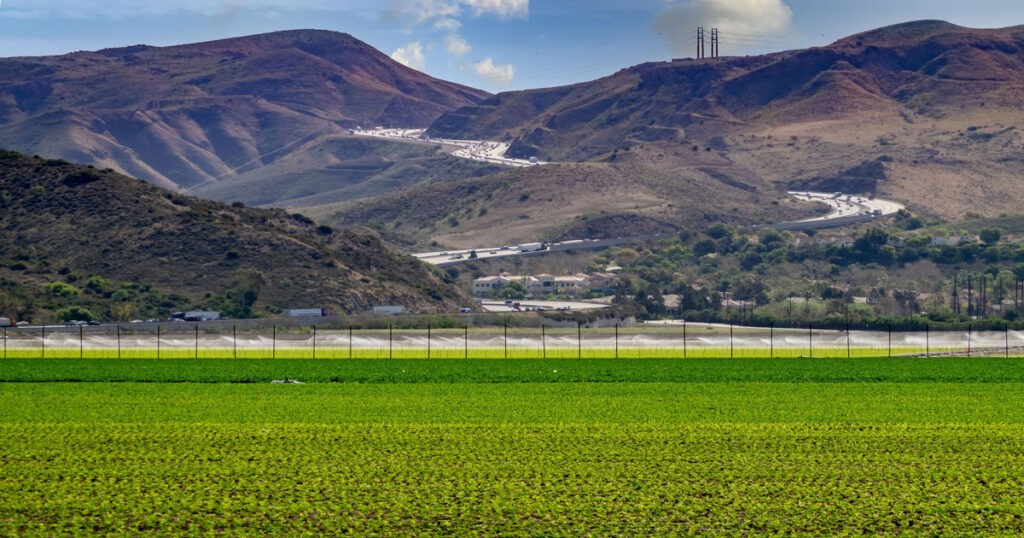
What is my home worth in Camarillo? This 2026 seller guide explains what drives local home values, why online estimates can miss the mark, and how to get an accurate, property-specific valuation from a local REALTOR®.
Median Home Price in Ventura, CA (2026 Update)
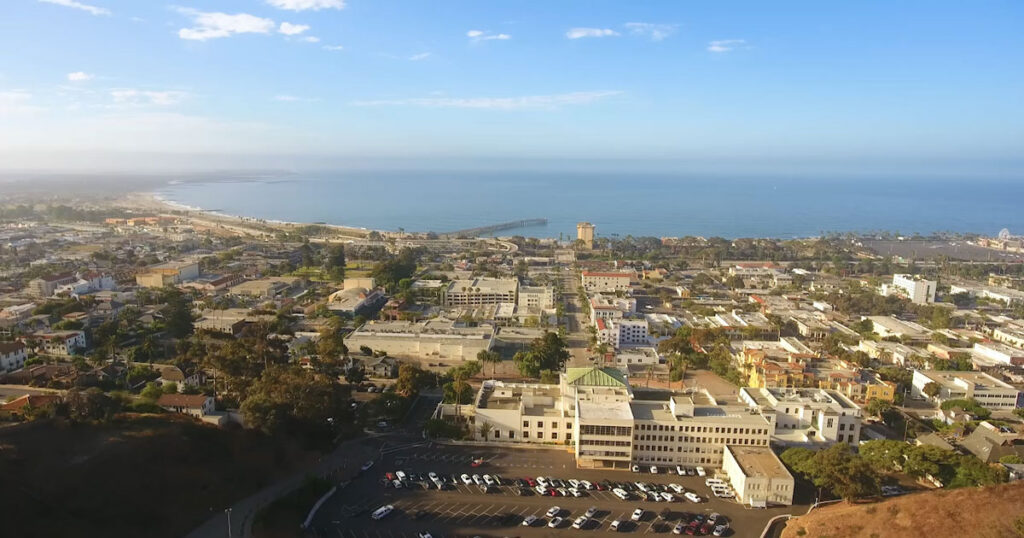
The median home price in Ventura, CA is about $899K in 2026. See current prices by neighborhood, why Redfin and Zillow differ, and what today’s market means for Ventura buyers and sellers.
Mortgage Rates Today in Ventura County: What Changed This Week (June 2026)

Mortgage Rates Today in Ventura County: Up or Down? Mortgage Rates Today in Ventura County: What Changed This Week Updated June 17, 2026 Mortgage Rates Today in Ventura County: What Changed This Week Rates moved higher—but a major development in the oil market may have created a more favorable path for buyers heading into summer. Get a Personalized Buying Plan Call 805.212.9147 Local market guidance from Zac Wasserman, REALTOR® with RE/MAX ONE If you are tracking mortgage rates today, Ventura County buyers got a genuinely interesting week. Rates nudged up over the past several days as stubborn inflation and elevated oil prices placed renewed pressure on the market—yet a major weekend development shifted part of the outlook in the other direction. So which way are rates actually heading? Below, I will break down where rates sit right now, what moved them, and what it could mean if you are buying a home in Ventura County this summer. I am Zac Wasserman, a local REALTOR® with RE/MAX ONE, and I update this rate snapshot regularly so you can make decisions using current numbers rather than a headline from three months ago. The Bottom Line Rates rose slightly, but the near-term outlook improved The latest completed Freddie Mac survey placed the 30-year fixed at 6.52%. Inflation remains the main obstacle, but falling oil prices could reduce some pressure if the U.S.–Iran framework holds and energy markets continue stabilizing. 30-Year Fixed 6.52% Freddie Mac weekly average Current Rate Snapshot Mortgage Rates Today in Ventura County: This Week at a Glance Here is where several common loan categories stood around June 17, 2026. Mortgage rates today in Ventura County tend to track national markets because home loans are priced largely through national bond and mortgage-backed securities markets. Loan Type Average Rate 30-Year Fixed ~6.53% 15-Year Fixed ~5.84% 5/1 ARM ~5.84% 30-Year Jumbo ~6.67% 30-Year Refinance ~6.64% Rates shown are informational national averages, not an offer to lend. Your available rate may vary based on credit, down payment, loan amount, occupancy, property type, points, lender fees, and market conditions. For context, the 30-year fixed averaged 6.52% in Freddie Mac’s latest completed weekly survey, up from 6.48% the week before. One year earlier, the same loan averaged 6.84%. Despite the latest increase, the benchmark rate remained approximately 32 basis points below its year-earlier level. What Changed This Week—and Why The simple answer is that rates drifted higher, but the reasons behind the move matter more than a few basis points. 1 Inflation accelerated May’s Consumer Price Index increased 4.2% year over year, the highest annual reading in approximately three years and well above the Federal Reserve’s long-term 2% inflation objective. 2 Energy costs stayed elevated Oil and other energy costs remained sensitive to the Middle East conflict, adding to inflation concerns and reinforcing expectations that borrowing costs could remain elevated. Higher inflation typically creates upward pressure on mortgage rates because investors demand greater returns to offset the declining purchasing power of future payments. The Federal Reserve does not directly set mortgage rates. However, its policy outlook influences bond yields, investor expectations, and the broader cost of borrowing. A higher-for-longer outlook can therefore keep pressure on home-loan rates even when the Fed does not change its benchmark rate at a particular meeting. The New Variable The Iran Wildcard: Why the Proposed Peace Framework Matters A tentative U.S.–Iran framework announced over the weekend created a potential path toward restoring commercial traffic through the Strait of Hormuz, a critical shipping route for global energy supplies. Oil prices initially fell sharply as markets reacted to the prospect of improved supply. Why does that matter for your mortgage? Because part of the recent inflation pressure was connected to the conflict’s effect on oil and transportation costs. I covered that relationship in depth when I wrote about how the Iran war is pushing rates higher. If oil prices continue easing and that eventually produces cooler inflation data, some pressure on mortgage rates could also ease. However, the agreement was still fragile as of June 17, and full implementation was not guaranteed. Rates rose during the latest completed survey period, but the near-term path became somewhat more favorable than it appeared one week earlier. Real-World Affordability How Mortgage Rates Today Affect Ventura County Buyers Rate percentages can feel abstract. These examples translate today’s rates into estimated principal-and-interest payments at price points Ventura County buyers commonly encounter. Property taxes, homeowners insurance, mortgage insurance, closing costs, and HOA dues are not included. Example 1 $850,000 home with 20% down Estimated loan amount: $680,000Estimated rate: 6.53%Loan term: 30-year fixed Principal & Interest $4,311 estimated monthly At last June’s 6.84% average, the same loan would have produced an estimated principal-and-interest payment of approximately $4,451—about $140 more per month. Condo or Townhome Example $650,000 with 10% down Estimated $585,000 loan at 6.53% $3,709 estimated monthly principal and interest Jumbo Example $1.3 million with 20% down Estimated $1.04 million loan at 6.67% $6,690 estimated monthly principal and interest To see how these numbers compare with your income, cash reserves, and other monthly obligations, my guide on how much house can I afford in Ventura County walks through the calculation step by step. Your Number Will Be Different See what today’s rate means for your actual budget A small change in rate, down payment, or loan structure can materially change your monthly payment and purchasing power. Build My Buying Plan 30-Year vs. 15-Year vs. ARM: What Makes Sense Right Now? With the 30-year fixed near 6.53% and the 15-year fixed near 5.84%, the difference is meaningful. However, the lowest advertised rate is not automatically the best loan structure for every buyer. Loan Potential Advantage Primary Tradeoff May Fit Buyers Who… 30-Year Fixed Lower required payment and predictable rate More total interest over the full term Value flexibility and plan to own long term 15-Year Fixed Faster equity growth and less total interest Substantially higher required payment Have strong cash flow and prioritize rapid payoff 5/1 ARM Potentially lower introductory
Is Simi Valley a Good Place to Live? (2026 Honest Guide)

Thinking about living in Simi Valley? This honest 2026 local guide breaks down neighborhoods, schools, safety, commuting, cost of living, and what buyers should know before making a move.
What Is My Home Worth in Simi Valley? Your 2026 Seller’s Guide
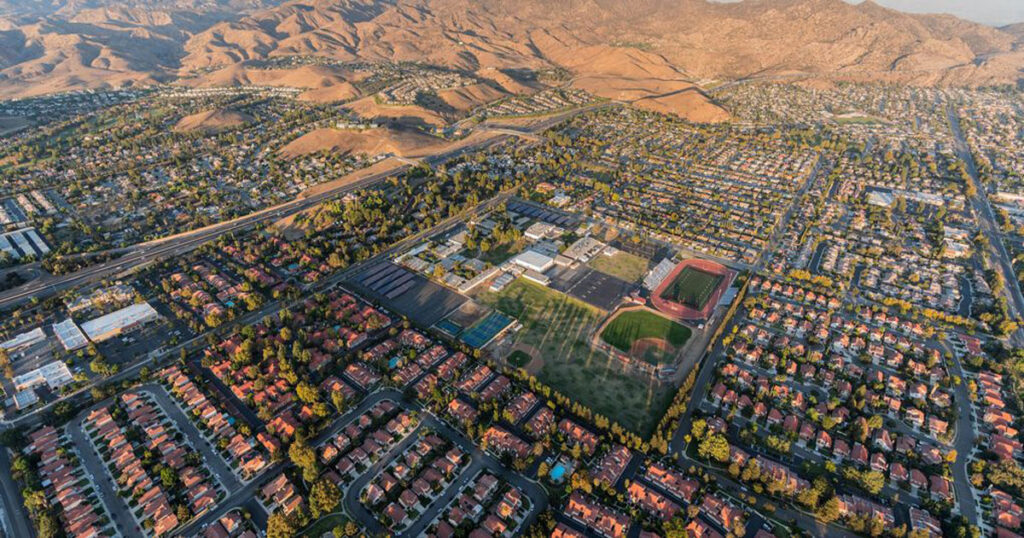
See mortgage rates today in Ventura County, what changed this week, and how current June 2026 rates affect local buyers, payments, and purchase strategy.
Should I Buy a Home in Ventura County Right Now? An Honest June 2026 Guide
Wondering if you should buy a home in Ventura County right now? Here’s an honest 2026 look at local prices, mortgage rates, buyer leverage, and when it makes sense to move forward versus wait.
How the Iran War Is Pushing Mortgage Rates Higher — And What Ventura County Buyers Should Do Now

Mortgage rates climbed from 5.98% to 6.53% after the Iran war started — here’s what Ventura County buyers should do now to protect their buying power.
San Fernando Valley Real Estate Market Update: May 2026
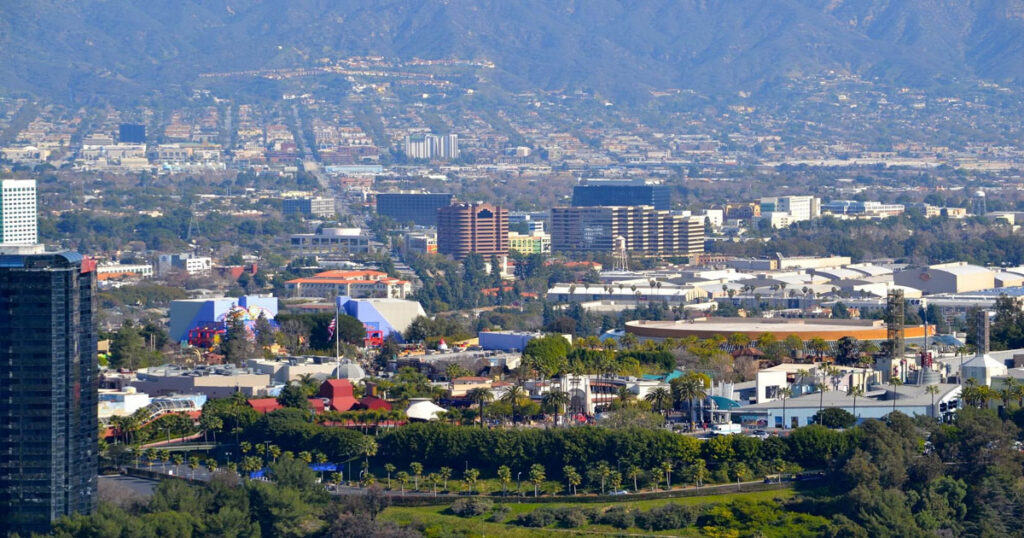
SFV closed 469 homes in May 2026 with a median sale price of $1,048,500. See prices by city, days on market, and what it means for buyers and sellers.
Ventura County Real Estate Market Update: May 2026

The Ventura County real estate market in May 2026 saw 545 closed sales, a $920,000 median price, and a 26-day median days on market. Here’s the full city-by-city breakdown and what it means for buyers and sellers.
Median Home Price in Camarillo, CA (2026): What Buyers and Sellers Need to Know

Camarillo home prices are holding strong in 2026. See median sale prices, market trends and what buyers and sellers need to know right now.
How Tariffs Are Affecting Home Prices in Ventura County (2026 Guide)
Tariffs are raising construction costs across Southern California — but what does that actually mean for home prices in Ventura County? Here’s the local impact and what buyers and sellers should do now.
Is Now a Good Time to Sell in Ventura County? (2026)

Is Now a Good Time to Sell in Ventura County? (2026) Ventura County Seller Guide Is Now a Good Time to Sell Your House in Ventura County? Summer 2026 Guide If you’ve been watching the market and wondering whether now is a good time to sell your home in Ventura County, you’re not alone. Thousands of homeowners across Thousand Oaks, Camarillo, Simi Valley, and Oxnard are asking the same question right now — and the answer depends on factors that go well beyond headlines. The short version: yes, summer 2026 presents a real opportunity for Ventura County sellers. However, “opportunity” does not mean every home sells easily. Pricing, preparation, presentation, and local demand all matter more than they did during the overheated 2021–2022 market. In This Guide What the Ventura County market looks like right now What the data says about selling in summer 2026 Why summer 2026 could work in your favor What is holding some sellers back How to maximize your sale price this summer What your home could be worth right now FAQ What the Ventura County Market Looks Like Right Now To understand whether now is a good time to sell, you first need a clear picture of where the market actually stands. Based on the most recent data, Ventura County continues to hold strong relative to most of Southern California. Median home prices across Ventura County remain elevated — particularly in inland cities like Thousand Oaks and Camarillo, where demand from LA-area buyers has helped keep values firm. Additionally, inventory levels in many Ventura County cities are still below historical norms, which means sellers in desirable areas are not competing against a flood of listings. That said, the market is not as frothy as it was in 2021 or 2022. Buyers are more selective today, mortgage rates remain in the mid-6% range as of mid-2026, and affordability constraints have softened demand at certain price points. According to the California Association of REALTORS®, statewide housing affordability remains historically low, which means the pool of qualified buyers — while active — is more rate-sensitive than it used to be. For a detailed look at recent numbers, check out my Ventura County housing market Q1 2026 breakdown, which covers median prices, days on market, and inventory by city. Is Now a Good Time to Sell in Ventura County? What the Data Says Yes — summer 2026 is generally a favorable time to sell your home in Ventura County, particularly if your property is well-priced and move-in ready. Here’s why the data supports that conclusion. First, buyer activity traditionally peaks in the spring and summer. Families often want to relocate before the school year, and longer daylight hours mean more showing opportunities. Therefore, demand is seasonally elevated right now compared to what you would typically see in November, December, or January. Second, Ventura County continues to attract significant interest from Los Angeles County buyers priced out of the Westside, San Fernando Valley, and other nearby markets. This relocation demand creates a consistent baseline of motivated, qualified buyers — many of whom are specifically searching for exactly what Ventura County offers: space, value, and relative proximity to work. Third, while interest rates are not low, they have stabilized. Buyers who were sitting on the sidelines waiting for a dramatic rate drop have largely accepted that 6%+ rates are the current reality, and many are moving forward. As a result, some of the hesitation that slowed the market in late 2023 and 2024 has eased. Furthermore, homes that are priced accurately are still selling within a competitive window in many Ventura County neighborhoods. Overpriced homes, however, are sitting longer and facing reductions. The current market rewards correct pricing far more than it did three years ago. Thinking about selling this summer? The first step is understanding what your home is realistically worth in today’s Ventura County market — not based on a generic online estimate, but based on recent comparable sales in your neighborhood. Get Your Free Home Valuation Why Summer 2026 Could Work in Your Favor Beyond the general market conditions, there are specific reasons why the summer 2026 window is worth taking seriously if you are considering selling. Inventory is still manageable. In many Ventura County neighborhoods, the number of active listings remains below what a fully balanced market would look like. That is good news for sellers. Fewer competing listings means more visibility, stronger showing activity, and in some cases, multiple-offer situations for the right property. LA-to-Ventura migration has not slowed. The relocation trend that accelerated after the pandemic has not fully reversed. Remote and hybrid work arrangements remain common, and Ventura County continues to attract buyers who want more home for their money without leaving Southern California. This cross-county demand provides a meaningful layer of support for local sellers. Summer buyers are motivated. Unlike casual browsers in January, summer buyers — particularly families — are often working against a real deadline. A buyer who wants their kids enrolled in Conejo Valley, Camarillo, Moorpark, or Simi Valley before fall may be highly motivated to close. That urgency can benefit sellers. Rates are stable, not spiking. While nobody is celebrating 6.5% mortgage rates, stability is better than volatility. Buyers can plan around a stable rate environment, and lenders are actively competing for business. That can translate to smoother transactions and fewer financing surprises. For context on the demand side, my post on whether you should wait to buy a house in 2026 gets into the buyer psychology driving decisions this year — which is worth understanding if you want to think like your buyer. What’s Holding Some Sellers Back — And Whether It Should Stop You Despite favorable conditions, a number of Ventura County homeowners are hesitating. Understanding these friction points can help you assess whether they apply to your situation. The rate lock-in effect. Many sellers refinanced between 2020 and 2022 and are sitting on mortgage rates between 2.5% and 3.5%. Trading that for a new purchase
Median Home Price in Simi Valley CA — 2026 Data & Trends
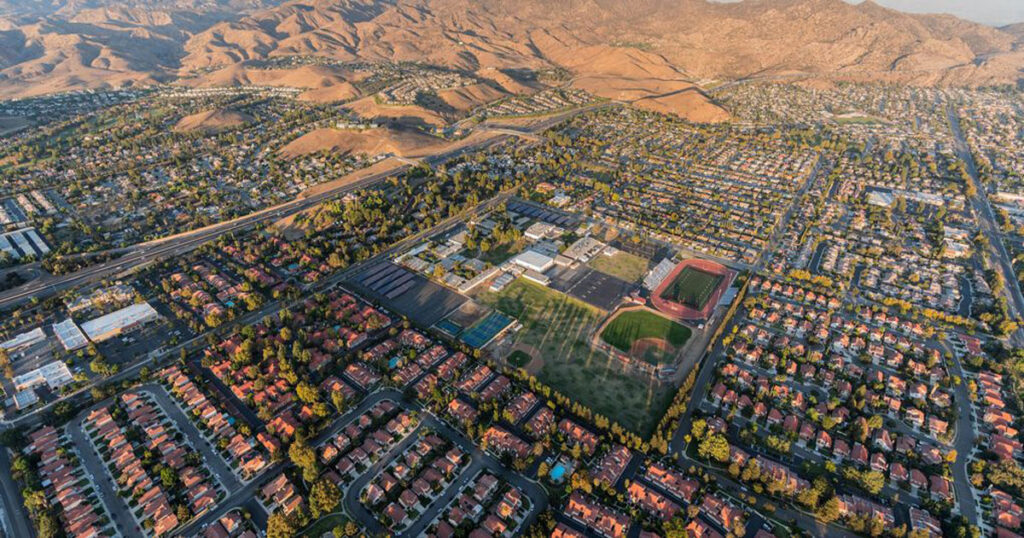
Median Home Price in Simi Valley CA — 2026 Data Simi Valley Real Estate Market 2026 Median Home Price in Simi Valley CA 2026: What Homeowners Need to Know A clear, local breakdown of Simi Valley home prices, neighborhood value ranges, market trends, and what sellers should understand before pricing their home. Find Out What Your Simi Valley Home Is Worth Median Home Price in Simi Valley CA 2026: What Homeowners Need to Know For July–September 2026, Redfin reports a Simi Valley median sale price of $814,612 across all home types. This rolling three-month measure is market context, not a valuation of your home. However, the more important question is not just “What is the median price?” It is “What does that number mean for your specific home?” That distinction matters because Simi Valley is not one uniform market. Wood Ranch, Big Sky, Central Simi, East Simi, West Simi, condos, townhomes, and larger single-family homes can all perform very differently. As a result, the median price gives you a helpful starting point, but it does not replace a neighborhood-specific pricing strategy. Below is a clear breakdown of Simi Valley home prices, local trends, neighborhood value ranges, and what homeowners should understand before making a selling decision in 2026. Quick Seller Takeaway Simi Valley is not a weak market, but it is a more selective one. Sellers who price accurately, prepare well, and launch with a clear strategy are in a much stronger position than sellers who rely only on broad online estimates. Median Home Price Simi Valley CA 2026: The Quick Answer The latest verified snapshot used here covers July–September 2026: $814,612 median sale price, 267 homes sold, 48 median days on market, and a 99.1% average sale-to-final-list ratio. Source checked October 22, 2026. Source: Redfin Simi Valley Housing Market, all home types, three months ending September 2026. Figures may be revised as records arrive. For city-level comparisons, use the same source, property types, and reporting period. A home-value index, an average price, and a median closed-sale price measure different things. Recent sales describe the homes that changed hands during the period. Changes in the property mix can move the median even when an individual home’s value has not changed by the same amount. For homeowners, that means pricing strategy matters more than ever. What the 2026 Simi Valley Housing Data Shows The 2026 Simi Valley real estate market is best described as steady, but selective. This article uses one dated Redfin snapshot rather than combining figures from different months and methodologies. Median days on market measures listing-to-contract time for homes going under contract in the period. It is not cumulative MLS time for closed sales. The sale-to-list ratio averages sale price divided by final asking price. When you put these numbers together, a few patterns become clear: Redfin · Simi Valley · All home types · July–September 2026 Median sale price $814,612 Homes sold 267 Median days on market 48 days Average sale-to-final-list 99.1% Therefore, the market is not “bad.” It is simply less forgiving. A well-priced, well-prepared home can still attract strong buyer attention. However, a home that is priced too aggressively may sit, reduce, and ultimately sell for less than it could have with a tighter launch strategy. Why Simi Valley Prices Are Holding Steady Simi Valley continues to hold value because it offers a combination of space, suburban lifestyle, relative affordability, and access to both Ventura County and the San Fernando Valley. Compare nearby cities using matching dates and property types. A difference in citywide medians does not measure how much more home an individual buyer receives for each dollar. That value gap matters. Many buyers who initially search in Thousand Oaks, Westlake Village, or parts of the Conejo Valley eventually compare Simi Valley because they can often find larger lots, more square footage, or a more attainable monthly payment. Similarly, some buyers priced out of Moorpark or certain Conejo Valley neighborhoods may consider Simi Valley as a practical alternative. However, affordability is still a constraint. Mortgage rates, insurance costs, property taxes, and monthly payment sensitivity all affect buyer behavior. Consequently, buyers are looking closely at price, condition, commute, updates, layout, and resale value before making offers. That is why what homes are selling for in Simi Valley is only part of the story. The better question is whether your home sits above, below, or right in line with buyer expectations for its neighborhood and condition. Simi Valley Neighborhood Price Ranges in 2026 Simi Valley’s median price can be misleading if you apply it too broadly. A condo, an older West Simi single-family home, a Central Simi tract home, and a Wood Ranch property are not competing in the same exact buyer pool. Compare current sales and active competition within the actual tract and property type. Broad neighborhood price bands can become outdated quickly. For neighborhood context and a starting point for comparing areas, explore the Simi Valley real estate and neighborhood guide. Wood Ranch includes multiple tracts and property settings; compare the specific floor plan, condition, lot, and association obligations. Big Sky is a northern Simi Valley hillside community. Central, East, and West Simi are broad search labels, so evaluate actual streets and properties. West Simi Valley often appeals to buyers who want to stay under the higher price thresholds while still buying a single-family home. Additionally, condos and townhomes remain important because affordability has become a major driver in Ventura County. Instead of using one citywide median number to price a property, the right pricing strategy should factor in neighborhood, property type, condition, upgrades, lot size, location, floor plan, and current competing inventory. Simi Valley vs Nearby Ventura County Cities Simi Valley’s value proposition becomes clearer when you compare it with nearby Ventura County and Conejo Valley cities. For neighborhood context and a starting point for comparing areas, explore the Simi Valley real estate and neighborhood guide. Compared with the median home price in Thousand Oaks, Simi Valley generally offers a lower entry
Median Home Price in Ventura County in 2026 — A City-by-City Breakdown
Median home prices in Ventura County vary by nearly $300,000 depending on the city. Here’s the full 2026 breakdown — by market.
Is Camarillo a Good Place to Live? An Honest 2026 Local Guide
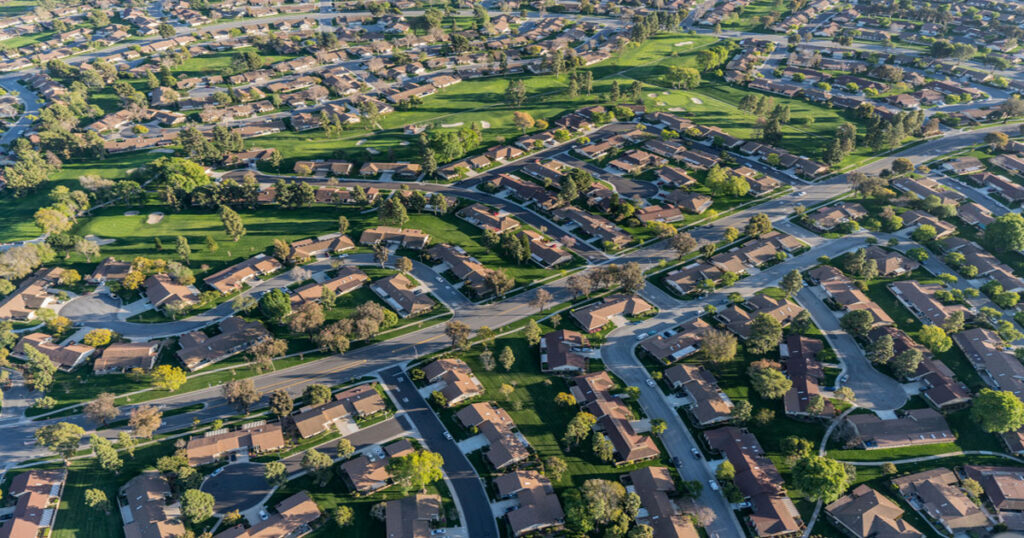
Thinking about living in Camarillo, CA? Get an honest 2026 look at neighborhoods, schools, commute times, cost of living, and the local real estate market — from a local REALTOR® who knows it well.