
Ventura County Real Estate Market Update: September 2026
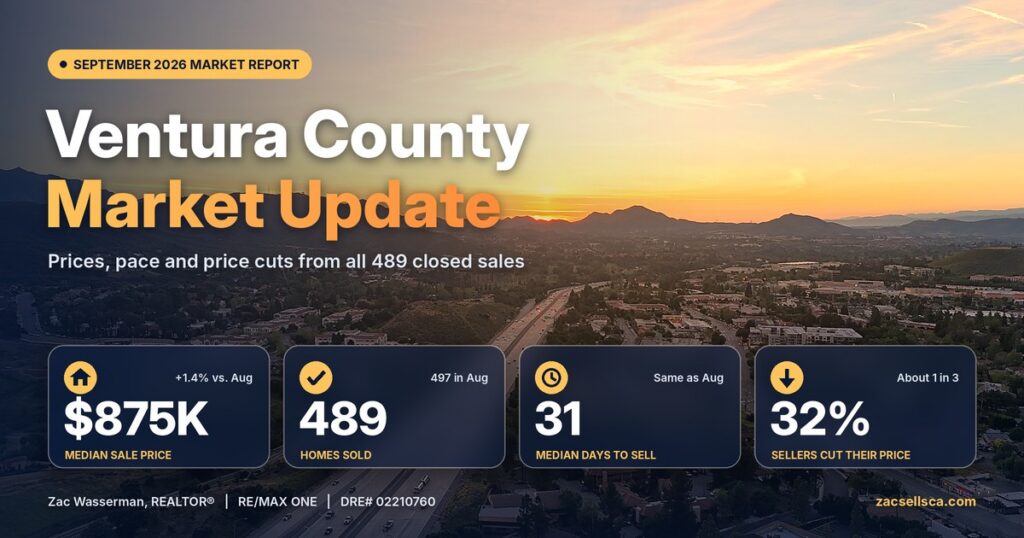
Ventura County’s September 2026 housing market: $875K median price, 489 closed sales, 31 days on market, and city-by-city data for buyers and sellers.
State Farm New Policies in California (2026): Who Qualifies & What Ventura County Homeowners Should Do

State Farm filed to start writing new California home policies again, but only for homes with an IBHS Wildfire Prepared Home designation. Here’s who qualifies, why you shouldn’t drop the FAIR Plan yet, and what Ventura County homeowners, buyers and sellers should do now.
Will the Housing Market Crash in 2027? An Honest Ventura County Forecast
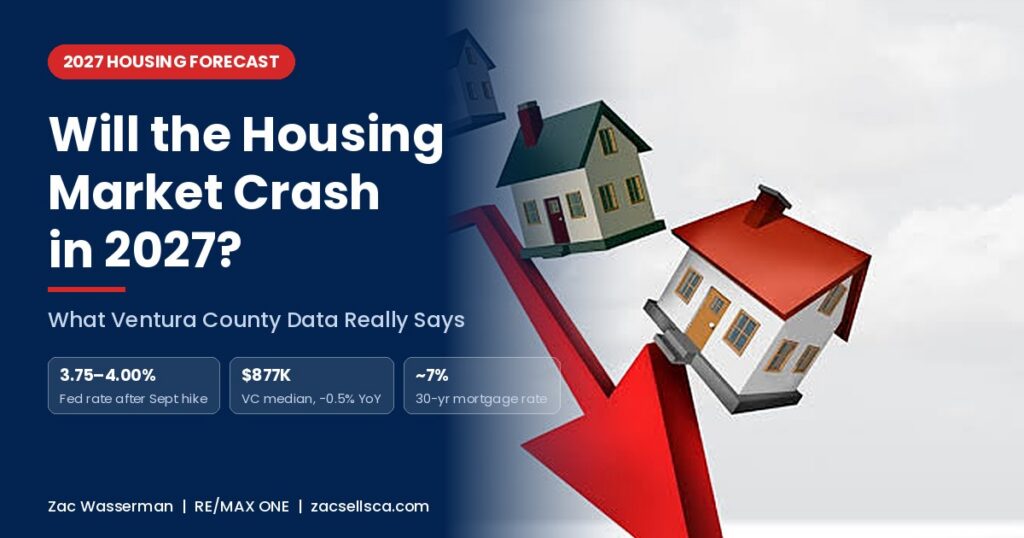
Will the housing market crash in 2027? After the Fed’s September hike, see what Ventura County prices, inventory and foreclosures say about next year.
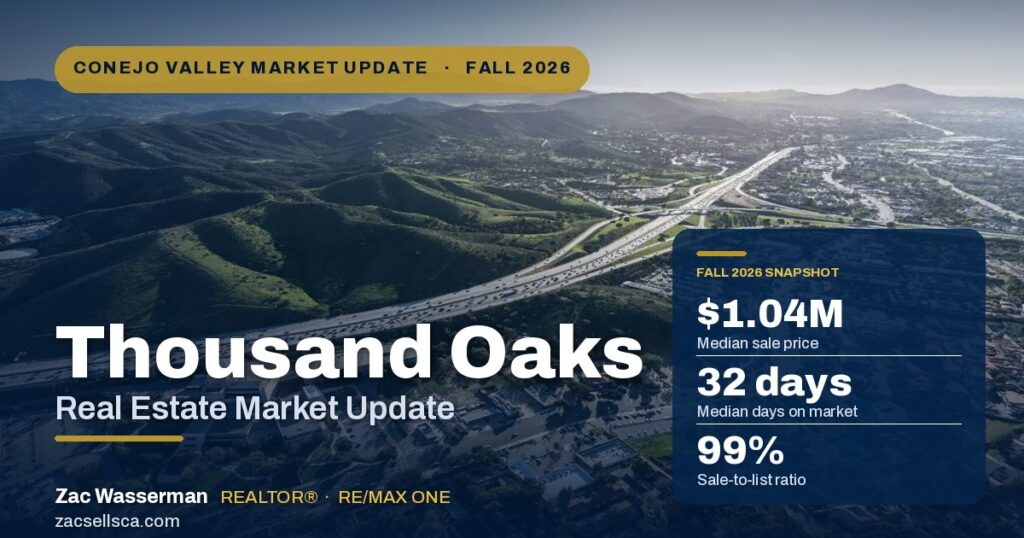
Thousand Oaks Real Estate Market Update: Fall 2026
Can you sell an ADU separately in California under AB 1033? See the 2026 status for Ventura County and Los Angeles, plus costs, financing, and how homeowners can prepare.
Ventura County Real Estate Market Update: August 2026
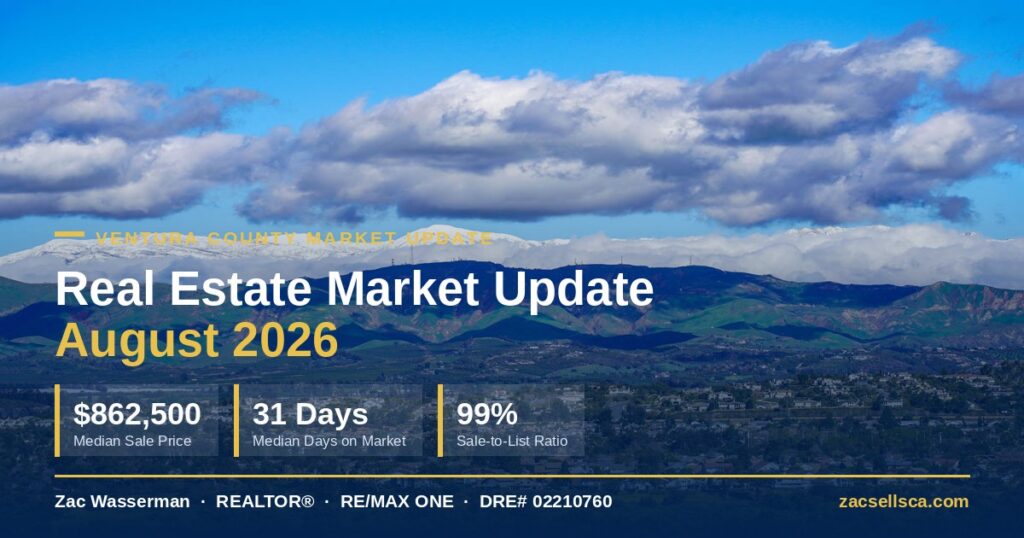
Ventura County Real Estate Market Update: August 2026 Ventura County Market Update — August 2026 Ventura County Real Estate Market Update: August 2026 If you have been watching home prices in our area and wondering where things actually stand, this Ventura County real estate market update for August 2026 gives you the real numbers. I pulled every closed sale across the county for the month—497 in total—and broke them down by price, days on market, and city. As a licensed REALTOR® with RE/MAX ONE, my goal here is simple: give you an honest, data-first read so you can make a confident decision, whether you are buying, selling, or simply keeping an eye on your equity. The short version? Ventura County remains a firm, well-balanced market. Prices are holding, well-priced homes are still moving quickly, and sellers are collecting very close to their asking price. However, the pace varies a lot depending on your city and price point, and that nuance is exactly where opportunity lives. Throughout this report, I will translate the raw data into what it practically means for your next move. Get My Free Home Valuation Call Zac: 805-212-9147 Ventura County Real Estate Market Update at a Glance (August 2026) Let’s start with the headline figures. Across all 497 closed sales in August, the median sale price landed at $862,500. The average sale price was noticeably higher at roughly $1.1 million, but that gap tells a story: a handful of luxury closings—including a $6.67 million Somis estate and a $6.24 million Thousand Oaks property—pull the average upward. As a result, the median is the more reliable number for most buyers and sellers, because it reflects the typical home rather than the outliers. Here are the county-wide vitals for the month: Median Sale Price $862,500 All property types Single-Family Median $959,500 Detached homes Median Days on Market 31 Days Countywide Sale-to-List Ratio 99% Typical sale Price Per Sq. Ft. $511 Countywide median At / Above Asking 43% Of August sales Cash Purchases ~10% Roughly 1 in 10 sales Additionally, single-family homes made up the bulk of activity, with 374 of the 497 closings. Condominiums accounted for 71 sales and townhomes another 46, so buyers seeking lower price points still had meaningful attached-home inventory to choose from. In short, this was a broad, active month rather than a market propped up by one narrow segment. For Ventura County Homeowners What do these August numbers mean for your home? Countywide statistics are useful, but your neighborhood, condition, lot, upgrades, and exact price range determine what buyers are likely to pay. Get a local value range based on today’s market. Request a Free Home Valuation Median Home Prices Across Ventura County At a $862,500 countywide median, Ventura County continues to sit in a healthy, move-up-friendly range. Furthermore, the spread of sales shows a market with real depth at every level. In August, 31 homes closed under $500,000, while 121 sold between $500,000 and $750,000. The largest slice—164 sales—fell in the $750,000 to $1 million band, followed by 112 sales between $1 million and $1.5 million. Finally, 69 homes traded above $1.5 million, including 39 above the $2 million mark. August Sales by Price Range 31 Under $500K 121 $500K–$750K 164 $750K–$1M 112 $1M–$1.5M 69 Above $1.5M Because inventory is spread so evenly across price tiers, this is not a market that only serves one type of buyer. First-time buyers, move-up families, and luxury purchasers all found homes that closed in August. The countywide median of $511 per square foot is another useful anchor, though it varies widely by city—from the mid-$300s in Santa Paula to roughly $675 in Westlake Village. If you are trying to gauge your own buying power against these prices, my guide on how much house can I afford in Ventura County walks through the math step by step. How Fast Are Homes Selling? Days on Market in August 2026 31 Median days on market 29% Closed in 2 weeks or less Speed is one of the clearest signals of market health, and here the data is encouraging for sellers. The median home spent just 31 days on market before going under contract. Even better, 29% of all August sales closed in two weeks or less, which tells you that sharply priced, well-presented homes are still commanding urgency. However, the average days on market—about 46—ran higher than the median. Consequently, this reveals a two-speed market: turnkey, correctly priced homes fly, while overpriced or dated listings sit and eventually negotiate. In other words, presentation and pricing strategy matter more than ever. Therefore, if you are preparing to list, the pre-market prep work is where deals are won or lost. A home that launches clean, staged, and priced to the comparables can still generate the kind of early urgency that leads to a strong offer. Are Homes Selling Over Asking? Sale-to-List Trends The county’s median sale-to-list ratio held at a strong 99% in August, meaning the typical seller collected 99 cents on every dollar of their asking price. Moreover, 43% of homes closed at or above their list price, and 17% sold for more than asking outright. That is a clear sign that competitive, in-demand properties are still drawing multiple offers. 99% Median sale-to-list ratio 43% Closed at or above asking 17% Sold above asking On the other hand, 43% of sales closed below asking, which underscores the same lesson from the days-on-market data. When a home is priced ahead of the market, buyers push back. Since roughly one in ten buyers paid cash, sellers who prepare well and price to the comps are the ones capturing top dollar. This balance—firm but not frenzied—is what makes the current market feel so stable compared to the extremes of recent years. Ventura County Real Estate Market Update by City County averages are useful, but real estate is hyper-local, so here is how each major city performed in August. The list below covers every city with at least eight closed sales for the
Best Neighborhoods in Thousand Oaks, CA (2026 Guide)
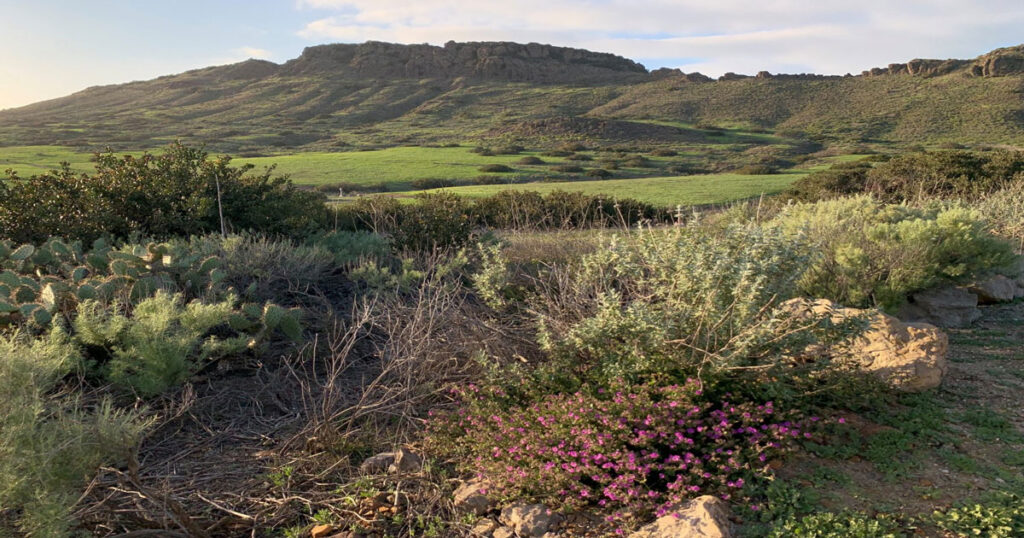
Explore the best neighborhoods in Thousand Oaks, CA for 2026 — from North Ranch luxury to family-friendly Dos Vientos. A local REALTOR’s honest guide.
Thousand Oaks vs. Westlake Village: Which Is Right for You in 2026?
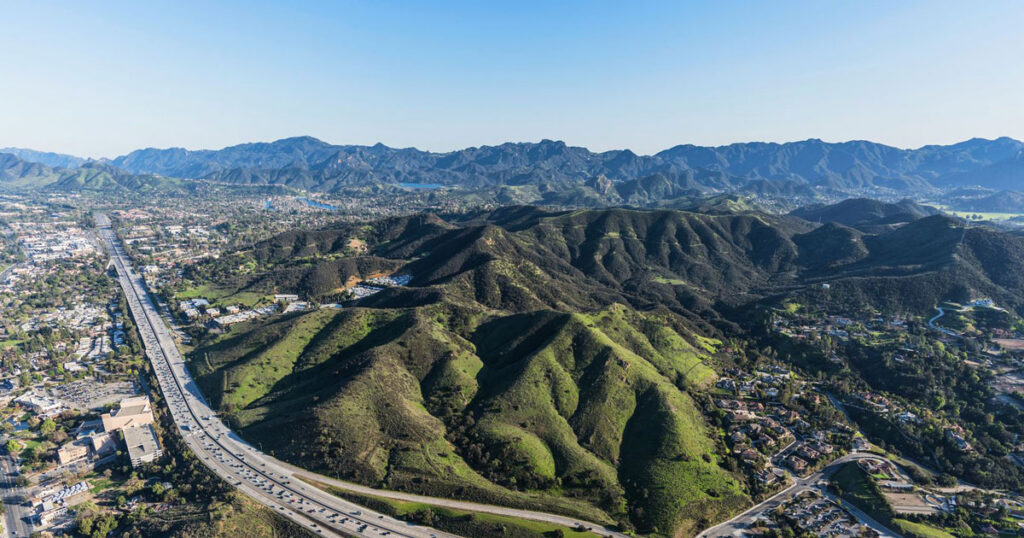
Thousand Oaks vs. Westlake Village (2026): Which Is Best? Thousand Oaks vs. Westlake Village 2026 Conejo Valley Buyer’s Guide Thousand Oaks vs. Westlake Village: Which Is Right for You in 2026? Compare home prices, schools, lifestyle, commute, and the county-line detail most buyers miss—then find the community that fits your real life. Compare the Two Cities Get a Free Home Valuation If you’re weighing Thousand Oaks vs. Westlake Village, you’re comparing two of the most sought-after communities in the Conejo Valley — and two markets that feel far more different than their five-mile gap suggests. As a licensed REALTOR® with RE/MAX ONE who lists and sells in both areas every week, I field this exact question constantly, especially from buyers relocating out of Los Angeles. Therefore, I’ve put together an honest, side-by-side breakdown of home prices, schools, lifestyle, commute, and the surprising county-line quirk that confuses almost everyone. By the end, you’ll know which city actually fits your budget and your day-to-day life. Both communities sit at the eastern edge of the Conejo Valley, share the same gorgeous foothill setting, and consistently rank among the safest, most family-friendly places in Southern California. However, they attract very different buyers for very different reasons. So let’s get into it. Thousand Oaks vs. Westlake Village at a Glance (2026) Here’s the quick snapshot before we dig into the details: Factor Thousand Oaks Westlake Village Vibe Large master-planned city Small luxury lakeside enclave Population ~127,000 ~8,000 (incorporated city) Incorporated 1964 1981 County Ventura Los Angeles (incorporated city)* Median home price (2026) ~$1.05M ~$1.5M–$1.8M School district Conejo Valley Unified Las Virgenes / Conejo Valley Unified* Best for Space, value, and selection Prestige, privacy, and the lake *The county and school-district lines are the confusing part — much more on that below. In short, Thousand Oaks gives you scale, selection, and relative value, while Westlake Village gives you exclusivity and a resort-like setting at a premium. Now let’s break down each factor so you can see where you land. Home Prices in Thousand Oaks vs. Westlake Village Price is usually the first place this decision gets real, so let’s start there. As of mid-2026, the median home price in Thousand Oaks sits right around $1.05 million, and it has stayed roughly flat over the past year. Because Thousand Oaks is a large city with everything from condos and townhomes in the $500,000s to custom estates north of $3 million, you get genuine range here. As a result, buyers with a $700,000 to $1.2 million budget find the deepest pool of options anywhere in the county. For a fuller look at the numbers, see my complete breakdown of the median home price in Thousand Oaks. Westlake Village, in contrast, runs meaningfully higher. Depending on which source and metric you use, the typical Westlake Village home value lands somewhere between $1.5 million and $1.8 million in 2026 — roughly 50% above Thousand Oaks. Additionally, because Westlake Village is a small market with relatively few sales each month, its median can swing noticeably from one month to the next. Therefore, I always steer clients toward neighborhood-level pricing rather than a single citywide number. My Westlake Village market update tracks those shifts in more detail. Why the gap? First, Westlake Village skews heavily toward larger, higher-end homes, gated communities, and lakefront or view properties. Second, its scarcity — only a few thousand homes in total — keeps prices elevated. Finally, the prestige factor is real: Westlake Village is routinely described as one of the wealthiest communities in the greater Los Angeles area. Consequently, if your budget tops out near $1 million, Thousand Oaks will simply give you far more house and far more choice. It’s also worth noting the 2026 backdrop. Inventory remains tight across the Conejo Valley, months of supply is low, and well-priced homes still sell quickly in both cities. Statewide, the California Association of REALTORS has tracked this same pattern of limited supply and more cautious buyers throughout 2026. However, buyers today have more negotiating room than they did during the frenzy of a few years ago. As a result, pricing a home correctly from day one matters more than ever — in both markets. Buying or selling in the Conejo Valley? Get a local, address-specific read on value, school boundaries, and current competition before you make your next move. Start with a Free Home Valuation The County-Line Quirk Most Buyers Miss Here’s the part that surprises nearly everyone, and it genuinely affects your search. Most people assume Westlake Village is a Ventura County city. However, the incorporated City of Westlake Village actually sits in Los Angeles County. When the original Westlake master-planned community was developed straddling the county line, California law prevented a single city from spanning two counties. As a result, the Ventura County portion was annexed into Thousand Oaks back in 1968 and 1972, while the remaining Los Angeles County portion incorporated separately as the City of Westlake Village in 1981. What does that mean in practice? Many homes that buyers picture as “Westlake Village” are technically inside Thousand Oaks city limits, in Ventura County. Meanwhile, the official incorporated city — with its own city hall — sits on the LA County side. The county line runs right through Westlake Lake. Because of this split, two nearly identical homes a few blocks apart can fall in different counties, different cities, and different school districts. Therefore, never assume based on the “Westlake Village” label alone — always map the exact address before you write an offer. Schools: How the District Lines Really Work For most families, schools drive this decision as much as price does. Fortunately, both areas are served by highly regarded districts — but which one you get depends entirely on the address. Thousand Oaks, along with the Ventura County side of Westlake Village, falls under Conejo Valley Unified School District (CVUSD). Notably, Westlake High School — located on the Ventura County side and part of CVUSD — is widely considered the
What Is My Home Worth in Oxnard? Your 2026 Home Value Guide

What Is My Home Worth in Oxnard? Your 2026 Home Value Guide Oxnard Home Values • 2026 MLS Data What Is My Home Worth in Oxnard? Your 2026 Home Value Guide Real 2026 Oxnard MLS sale data, ZIP-code pricing, days on market, and the factors that can move your home’s value by six figures. Get My Free Home Valuation What Is My Home Worth in Oxnard? If you own a home along the coast, in RiverPark, or anywhere in between, you have probably typed “what is my home worth in Oxnard” into Google and landed on a Zillow estimate that felt either too high or suspiciously low. As a licensed REALTOR® with RE/MAX ONE serving Ventura County, I hear the same frustration from Oxnard sellers every week. Therefore, instead of guessing, this guide walks you through what real 2026 MLS sale data actually shows, why your ZIP code matters more than you think, and how to get a number you can trust. Let me be clear up front: an automated estimate is a starting point, not an answer. However, the closed sales in your own neighborhood tell the real story, so that is exactly where we will start. 2026 Oxnard Snapshot What Is My Home Worth in Oxnard Right Now? (2026 Snapshot) Over the most recent 90-day period, 210 residential properties closed escrow in Oxnard. Consequently, we have a large, current sample to work from rather than a stale annual average. Here is what those closings show: $802,500 Median Closed Price 20 Days Median Days on Market 100% Median Sale-to-List $517 Median Price / Sq. Ft. Additionally, the picture sharpens when you separate property types. Single-family homes carried a median closed price of $829,750 and sold in a median of just 17 days at $540 per square foot. Condos, by contrast, closed at a median of $642,500, while townhomes landed at $599,000. As a result, the honest answer to what your Oxnard home is worth depends heavily on what kind of home you own before we even discuss location. Furthermore, that 100% sale-to-list ratio is a meaningful signal. Because homes are closing right at asking price and moving in under three weeks, well-priced Oxnard listings still command strong demand in 2026. For a fuller market picture, you can also review my Ventura County market update for the latest county-wide trends. Oxnard Home Values by ZIP Code: Why Location Changes Everything Here is where most online estimates fall apart. Oxnard is not one market — it is at least four, and the price gap between them is enormous. When I pulled the closed sales by ZIP code, the spread was striking: ZIP Code Key Areas Median Closed Price Market Note 93035 Oxnard Shores, Mandalay Bay, the Harbor $1,091,500 Waterfront premium 93036 RiverPark and north Oxnard $770,000 North-Oxnard benchmark 93030 Central and old-town Oxnard $760,000 Central-city benchmark 93033 South and east Oxnard $730,000 11 DOM • 102% of list The ZIP-code gap is more than $360,000. Two similar homes can live in completely different pricing worlds depending on location. In other words, two identical houses can be worth over $360,000 apart depending on which side of the city they sit on. Therefore, any tool that gives you a single “Oxnard” number without accounting for your ZIP code is almost guaranteed to be off. This is also why I always recommend sellers understand the best neighborhoods in Oxnard and where their own street fits in the pricing hierarchy. What Actually Determines Your Oxnard Home’s Worth Beyond ZIP code, several factors move the needle on your home’s value. Since sellers often overweight the wrong ones, let me break down what genuinely matters: Location within the neighborhood Proximity to the beach, water views, and quiet interior streets all carry premiums. Similarly, backing to a busy road or the 101 will pull value down. Condition and updates Because Oxnard’s median home was built around 1980, buyers pay real premiums for updated kitchens, newer systems, and move-in-ready condition. Conversely, deferred maintenance gets priced in aggressively. Square footage and lot Price per square foot averaged $517 across the city, but that figure climbs near the coast and dips inland. Additionally, usable lot space and functional floor plans both add value. Timing and competition With a median of 20 days on market, Oxnard is moving quickly — however, that can shift month to month, which is why current data beats last year’s numbers every time. Taken together, these factors explain why two homes with the same square footage can appraise thousands of dollars apart. For example, a remodeled three-bedroom two blocks from the sand in 93035 lives in a completely different pricing world than a comparable but dated home inland in 93033, even though a search engine may lump them together. Consequently, the most reliable valuations weigh each of these variables against genuinely comparable sales rather than a blanket citywide figure. Zillow vs. Reality: Why Online Estimates Miss the Mark in Oxnard Automated valuation models like the Zestimate are useful for a ballpark, but they struggle in a market as varied as Oxnard. Here is why. First, they lean on public records and past sales that may not reflect your home’s actual condition. Second, they cannot see inside your home — a fully remodeled kitchen and a 1985-original kitchen look identical to an algorithm. Third, and most importantly, they blend ZIP codes and property types together, which we just saw can swing value by six figures. For context, the California Association of REALTORS® publishes statewide median price data, and even those broad figures come with heavy regional caveats. As a result, the most accurate answer to your home’s value almost always comes from a local professional who can walk your home, weigh the comparable sales that truly match it, and adjust for the details a computer cannot see. Average Home Price in Oxnard vs. Your Home’s Real Value Why the average can mislead Average: ~$1,077,690 vs. Median: $802,500 Sellers often search for the average home price
Median Home Price in Ojai, CA (2026): What Real MLS Data Shows
See the real median home price in Ojai, CA for 2026, including current MLS sales data, price trends, days on market, and what the numbers mean for local buyers and sellers.
Ventura County Real Estate Market Update: July 2026
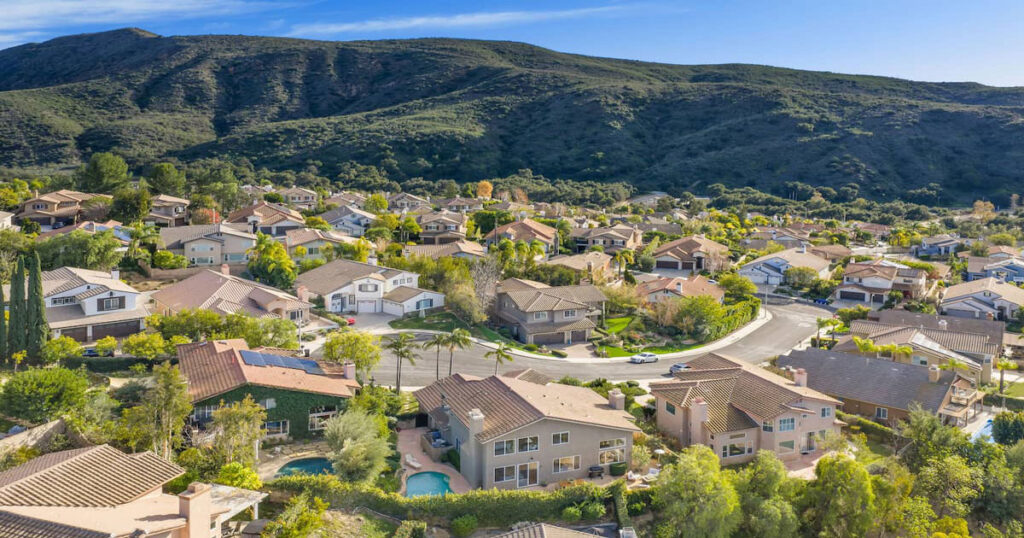
Ventura County’s July 2026 housing data is in. See the latest median home price, days on market, sale-to-list ratio, buyer concessions, and a full city-by-city breakdown based on 553 closed MLS sales.
Mountain Fire Rebuild Update: What Ventura County Homeowners & Buyers Need to Know (2026)
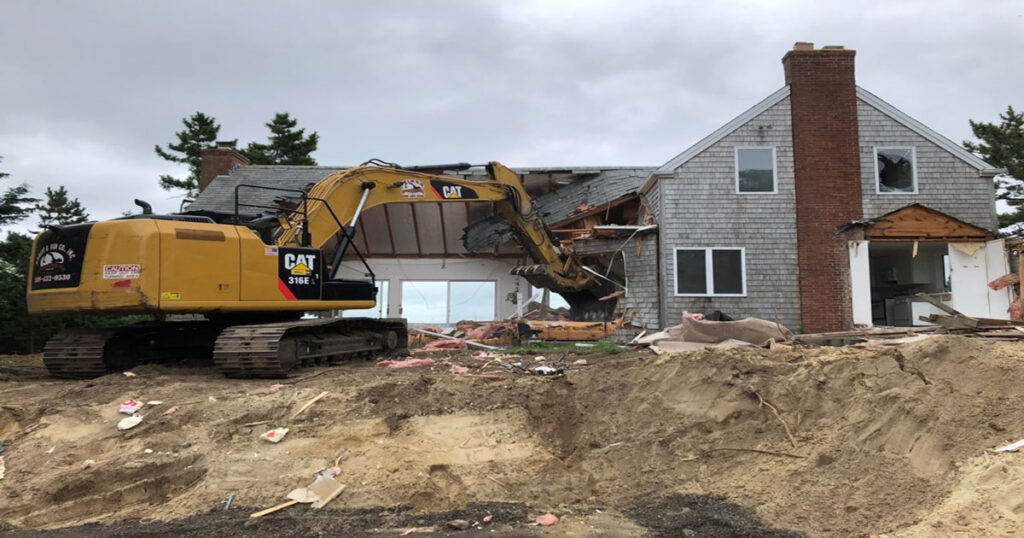
Nearly two years after the Mountain Fire, rebuilding in Ventura County is gaining real momentum. Here’s the 2026 status — permit counts, timelines, insurance realities, and what it all means for homeowners and buyers in Somis, Camarillo Heights, and Santa Rosa Valley.
Santa Paula Median Home Price in 2026: What the Latest MLS Data Shows

The Santa Paula median home price in 2026 is holding near $736,000. See the latest MLS data on price trends, market speed, and what buyers and sellers should know.
Ventura County Mortgage Rates: What the Fed’s July 2026 Decision Means for Buyers
Ventura County mortgage rates remain a major factor for buyers in 2026. Here’s what is driving rates, how the Federal Reserve may influence the market, and what local buyers should watch next.
Median Home Price in Moorpark, CA (2026): $980K & Holding
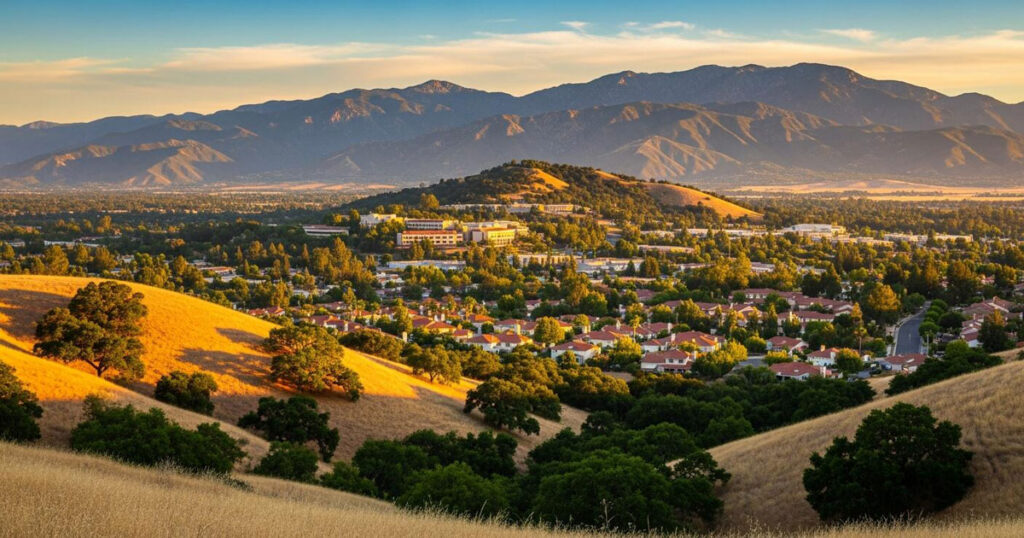
The median home price in Moorpark, CA held at $980,000 in 2026, while single-family homes averaged just over $1.03 million. See real MLS data on price trends, days on market, bedroom breakdowns, and what today’s market means for Moorpark buyers and sellers.
Best Neighborhoods in Oxnard, CA: Where to Live in 2026
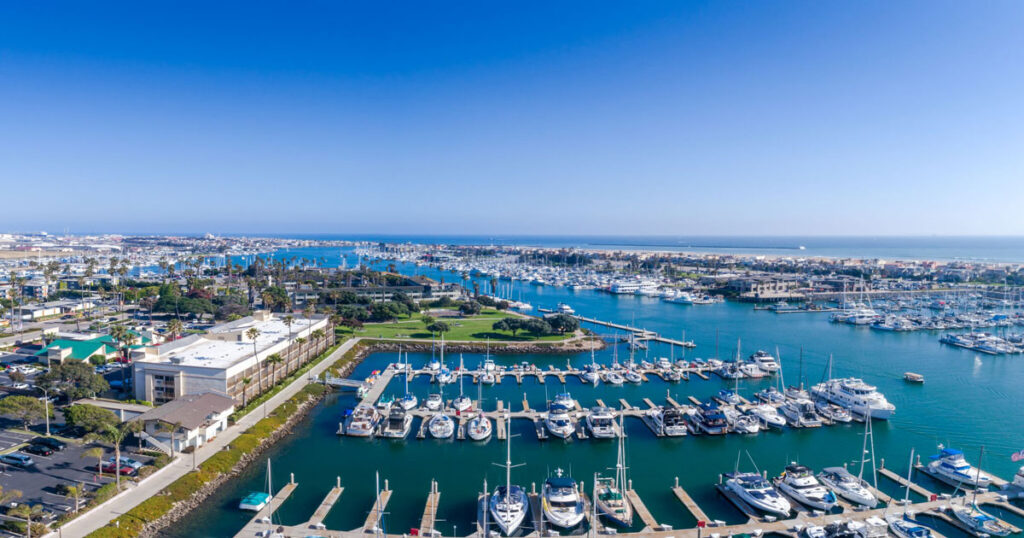
Oxnard’s median home price is $785,000 in 2026, but prices vary sharply by zip code, property type, and neighborhood. See real MLS closed-sales data, current market trends, and what the numbers mean for Oxnard buyers and sellers.