October Takeaways
- Choose two cities above to read their October figures in context.
These completed-sale figures are a starting point. Current competition and property-specific comparisons need a separate review.

ZacSellsCA · Statistics & Figures
The October 2026 Edition
Look beyond the headline. Explore monthly sales, compare two cities, and put the numbers into the context of your next move.
Your Market, in Focus
Compare the same property group and reporting month. These are completed sales—not current asking prices, market forecasts, or a valuation of an individual home.
Different homes sell in each city. Differences in these medians reflect the mix of completed sales and do not measure the price difference between equivalent homes.
See the Comparison
Every bar starts at zero. Select a city to make it your first comparison. A shorter bar is not a recommendation or a measure of investment potential.
Put the Numbers to Work
A short reading of your selected cities, a comparison you can save, and questions to bring to your next conversation.
These completed-sale figures are a starting point. Current competition and property-specific comparisons need a separate review.
Copy a short summary or print a market brief for the selected cities and property group. The brief includes the reporting month, sample sizes, source and calculation limits.
October 2026 is the first verified edition in this report. Month-over-month and year-over-year charts need comparable monthly records before they can tell a reliable story.
No trend line, change percentage or inventory estimate is inferred from this single month. Future editions must use consistent city labels, property groups and calculation methods.
A Place Behind Every Number
Explore all 20 communities in the October file. Open a card for its property-type breakdown, compare it with another city, or continue into its local guide. These cards always show all residential types; the breakdown separates the property groups.
20 communities in the October file · All Residential Types
October 2026 · Closed Sales
All Residential Types
Share of this city’s 66 reported closed records.
Days-on-Market Data Coverage98.5% · 65 of 66 records
49 closed records
17 closed records
No closed records in this property group in the supplied file.
October 2026 · Closed Sales
All Residential Types
Share of this city’s 83 reported closed records.
Days-on-Market Data Coverage100% · 83 of 83 records
61 closed records
21 closed records
1 closed record · Small Sample
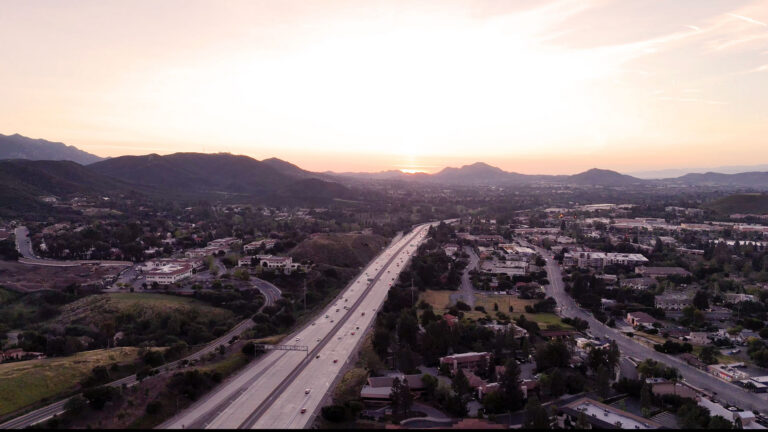
October 2026 · Closed Sales
All Residential Types
Share of this city’s 59 reported closed records.
Days-on-Market Data Coverage98.3% · 58 of 59 records
49 closed records
10 closed records
No closed records in this property group in the supplied file.
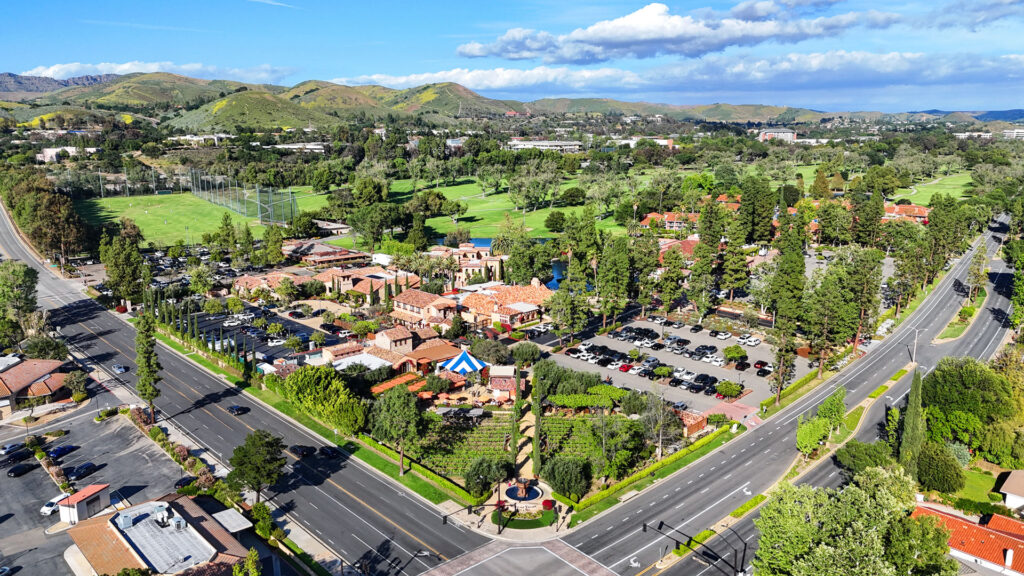
October 2026 · Closed Sales
All Residential Types
Share of this city’s 20 reported closed records.
Days-on-Market Data Coverage100% · 20 of 20 records
14 closed records
6 closed records · Small Sample
No closed records in this property group in the supplied file.
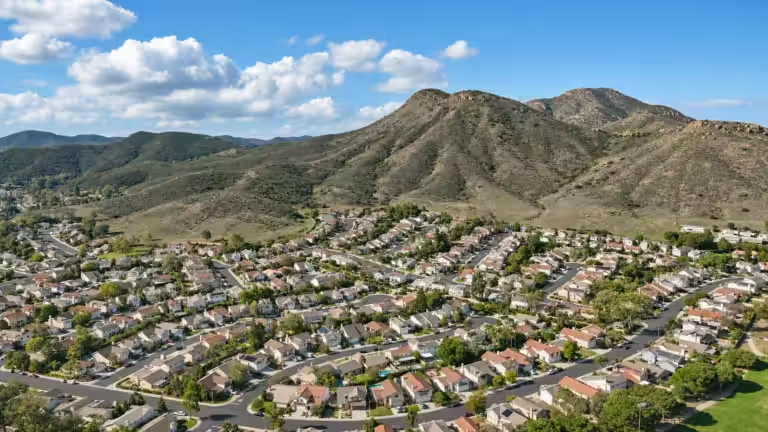
October 2026 · Closed Sales
All Residential Types
Share of this city’s 15 reported closed records.
Days-on-Market Data Coverage100% · 15 of 15 records
14 closed records
1 closed record · Small Sample
No closed records in this property group in the supplied file.
October 2026 · Closed Sales
All Residential Types
Share of this city’s 22 reported closed records.
Days-on-Market Data Coverage100% · 22 of 22 records
15 closed records
7 closed records · Small Sample
No closed records in this property group in the supplied file.
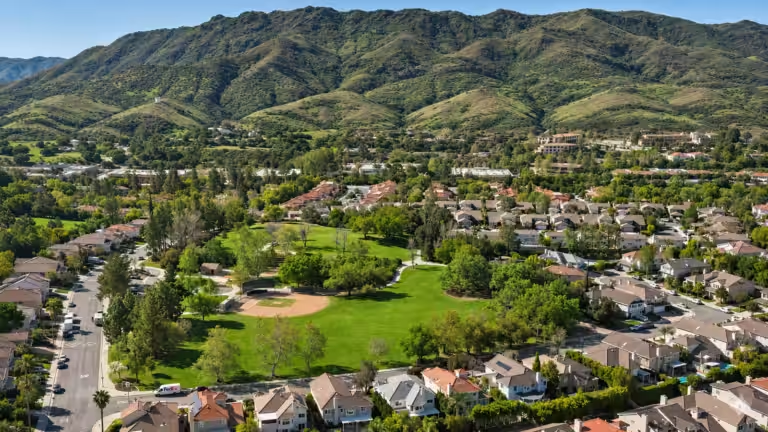
October 2026 · Closed Sales
All Residential Types
Share of this city’s 22 reported closed records.
Days-on-Market Data Coverage100% · 22 of 22 records
17 closed records
5 closed records · Small Sample
No closed records in this property group in the supplied file.

October 2026 · Closed Sales
All Residential Types
Share of this city’s 70 reported closed records.
Days-on-Market Data Coverage98.6% · 69 of 70 records
46 closed records
18 closed records
6 closed records · Small Sample
October 2026 · Closed Sales
All Residential Types
Small Sample · 2 closed records. One sale can substantially change a median.
Share of this city’s 2 reported closed records.
Days-on-Market Data Coverage100% · 2 of 2 records
2 closed records · Small Sample
No closed records in this property group in the supplied file.
No closed records in this property group in the supplied file.
October 2026 · Closed Sales
All Residential Types
Share of this city’s 12 reported closed records.
Days-on-Market Data Coverage100% · 12 of 12 records
11 closed records
1 closed record · Small Sample
No closed records in this property group in the supplied file.
October 2026 · Closed Sales
All Residential Types
Small Sample · 1 closed record. One sale can substantially change a median.
Share of this city’s 1 reported closed record.
Days-on-Market Data Coverage100% · 1 of 1 record
1 closed record · Small Sample
No closed records in this property group in the supplied file.
No closed records in this property group in the supplied file.
October 2026 · Closed Sales
All Residential Types
Share of this city’s 22 reported closed records.
Days-on-Market Data Coverage100% · 22 of 22 records
19 closed records
3 closed records · Small Sample
No closed records in this property group in the supplied file.
October 2026 · Closed Sales
All Residential Types
Share of this city’s 14 reported closed records.
Days-on-Market Data Coverage92.9% · 13 of 14 records
10 closed records
4 closed records · Small Sample
No closed records in this property group in the supplied file.
October 2026 · Closed Sales
All Residential Types
Small Sample · 2 closed records. One sale can substantially change a median.
Share of this city’s 2 reported closed records.
Days-on-Market Data Coverage100% · 2 of 2 records
2 closed records · Small Sample
No closed records in this property group in the supplied file.
No closed records in this property group in the supplied file.
October 2026 · Closed Sales
All Residential Types
Share of this city’s 19 reported closed records.
Days-on-Market Data Coverage94.7% · 18 of 19 records
16 closed records
2 closed records · Small Sample
1 closed record · Small Sample
October 2026 · Closed Sales
All Residential Types
Share of this city’s 63 reported closed records.
Days-on-Market Data Coverage98.4% · 62 of 63 records
49 closed records
14 closed records
No closed records in this property group in the supplied file.
October 2026 · Closed Sales
All Residential Types
Small Sample · 7 closed records. One sale can substantially change a median.
Share of this city’s 7 reported closed records.
Days-on-Market Data Coverage100% · 7 of 7 records
4 closed records · Small Sample
3 closed records · Small Sample
No closed records in this property group in the supplied file.
October 2026 · Closed Sales
All Residential Types
Share of this city’s 11 reported closed records.
Days-on-Market Data Coverage100% · 11 of 11 records
8 closed records · Small Sample
3 closed records · Small Sample
No closed records in this property group in the supplied file.
October 2026 · Closed Sales
All Residential Types
Share of this city’s 16 reported closed records.
Days-on-Market Data Coverage100% · 16 of 16 records
10 closed records
4 closed records · Small Sample
2 closed records · Small Sample
October 2026 · Closed Sales
All Residential Types
Small Sample · 2 closed records. One sale can substantially change a median.
Share of this city’s 2 reported closed records.
Days-on-Market Data Coverage100% · 2 of 2 records
2 closed records · Small Sample
No closed records in this property group in the supplied file.
No closed records in this property group in the supplied file.
No matching communities in this file. Try another city name.
City photographs are used where available from the matching guide. A citywide median is not a property valuation. Figures describe October 2026 completed sales and are manually refreshed from reviewed MLS data.
Keep the Detail
Search the complete file, switch property groups, or download an aggregate CSV to review at your own pace.
20 communities shown · All Residential Types
The Property Group selector above also controls this table. On a phone, scroll sideways to compare every column.
| City / MLS Label | Closed Sales | Median Sale Price | Median Days on Market | Average Sale / Final List |
|---|---|---|---|---|
| City Guide | 22 | $1,245,500 | 55.5 days22 valid records | 97.1% |
| City Guide | 5 | $599,000 | 32 days5 valid records | 96.2% |
| City Guide | 17 | $1,285,000 | 57 days17 valid records | 97.3% |
| 2 | $1,455,000 | 74 days2 valid records | 98.4% | |
| 2 | $1,455,000 | 74 days2 valid records | 98.4% | |
| City Guide | 66 | $831,400 | 35 days65 valid records | 98.4% |
| City Guide | 17 | $638,000 | 35 days17 valid records | 97.6% |
| City Guide | 49 | $892,000 | 35.5 days48 valid records | 98.6% |
| 12 | $702,500 | 27.5 days12 valid records | 98.9% | |
| 1 | $665,000 | 20 days1 valid record | 97.8% | |
| 11 | $705,000 | 30 days11 valid records | 99.0% | |
| 1 | $1,700,000 | 0 days1 valid record | 100.0% | |
| 1 | $1,700,000 | 0 days1 valid record | 100.0% | |
| 22 | $4,625,000 | 92.5 days22 valid records | 89.8% | |
| 3 | $1,750,000 | 28 days3 valid records | 91.4% | |
| 19 | $5,700,000 | 111 days19 valid records | 89.6% | |
| City Guide | 22 | $811,500 | 55 days22 valid records | 98.7% |
| City Guide | 7 | $490,000 | 83 days7 valid records | 98.6% |
| City Guide | 15 | $875,000 | 47 days15 valid records | 98.8% |
| City Guide | 15 | $945,000 | 43 days15 valid records | 98.2% |
| City Guide | 1 | $745,000 | 146 days1 valid record | 96.8% |
| City Guide | 14 | $977,500 | 41.5 days14 valid records | 98.3% |
| 14 | $1,208,000 | 46 days13 valid records | 97.0% | |
| 4 | $471,500 | 92 days4 valid records | 97.4% | |
| 10 | $1,400,000 | 27 days9 valid records | 96.9% | |
| 2 | $1,197,500 | 48.5 days2 valid records | 96.0% | |
| 2 | $1,197,500 | 48.5 days2 valid records | 96.0% | |
| 19 | $1,310,000 | 33.5 days18 valid records | 96.3% | |
| 2 | $655,000 | 33.5 days2 valid records | 96.7% | |
| 1 | $3,180,000 | 117 days1 valid record | 90.9% | |
| 16 | $1,370,000 | 29 days15 valid records | 96.6% | |
| 63 | $820,000 | 26 days62 valid records | 99.4% | |
| 14 | $737,000 | 36.5 days14 valid records | 100.0% | |
| 49 | $855,000 | 20 days48 valid records | 99.2% | |
| 7 | $609,000 | 82 days7 valid records | 100.3% | |
| 3 | $600,000 | 152 days3 valid records | 100.6% | |
| 4 | $644,000 | 64 days4 valid records | 100.0% | |
| 11 | $715,000 | 14 days11 valid records | 97.9% | |
| 3 | $440,000 | 83 days3 valid records | 93.3% | |
| 8 | $745,450 | 6.5 days8 valid records | 99.6% | |
| 16 | $732,495 | 36.5 days16 valid records | 99.6% | |
| 4 | $632,000 | 19 days4 valid records | 100.3% | |
| 2 | $999,500 | 47 days2 valid records | 100.1% | |
| 10 | $754,995 | 46 days10 valid records | 99.2% | |
| City Guide | 83 | $780,000 | 40 days83 valid records | 98.8% |
| City Guide | 21 | $520,000 | 51 days21 valid records | 98.1% |
| City Guide | 1 | $600,000 | 83 days1 valid record | 96.0% |
| City Guide | 61 | $829,950 | 38 days61 valid records | 99.1% |
| 2 | $2,731,250 | 311 days2 valid records | 83.4% | |
| 2 | $2,731,250 | 311 days2 valid records | 83.4% | |
| City Guide | 59 | $975,000 | 36.5 days58 valid records | 97.9% |
| City Guide | 10 | $461,500 | 29 days10 valid records | 97.6% |
| City Guide | 49 | $1,160,000 | 39.5 days48 valid records | 97.9% |
| City Guide | 70 | $902,500 | 23 days69 valid records | 98.6% |
| City Guide | 18 | $699,500 | 18 days18 valid records | 98.7% |
| City Guide | 6 | $810,250 | 59 days5 valid records | 98.4% |
| City Guide | 46 | $937,500 | 25 days46 valid records | 98.6% |
| City Guide | 20 | $1,585,000 | 35.5 days20 valid records | 97.7% |
| City Guide | 6 | $614,000 | 86 days6 valid records | 98.7% |
| City Guide | 14 | $1,831,250 | 26 days14 valid records | 97.2% |
No matching closed records in this file. Try another city or property group.
Source: Flexmls residential closed-sales search, October 1–31, 2026; retrieved November 10, 2026. Selected participating sources: CSMAR, CLAW, CRMLS, ITECH, and Southland Regional Association of REALTORS®. GPS MLS and High Desert MLS were not selected. Results use MLS city labels, not independently verified municipal boundaries.
Put a Place to the Numbers
Neighborhood context, school resources, local events, and a clear next step.
Use the monthly figures to frame questions about similar closed sales. A citywide median does not establish the value of a specific home or predict the terms a seller will accept.
Compare relevant completed sales with the homes competing for buyers today. Property type, condition, location, costs, and timing all matter to a pricing plan.
The search contains 528 Closed residential listing records with a closed date in October 2026 and one of the 20 selected MLS city labels. Listing IDs are unique; physical properties have not been independently deduplicated across different listing IDs. These are listing-record counts, not an assertion that every possible sale in each community is included.
Single-Family uses subtype SF. Condos and Townhomes combines CN and TH. Other Residential Types retains the remaining records, including manufactured, duplex, and unclassified entries. Groups with no records in this file do not receive an invented zero-price statistic.
Median sale price is the middle Closed Price. Median days on market uses the export’s Days on Market field and is not relabeled cumulative MLS time or Redfin’s listing-to-contract measure. Six negative days-on-market values are excluded from that metric only, with the valid sample shown in the table. Average sale-to-final-list is the mean of each record’s Closed Price divided by its final Listing Price.
The number and mix of homes sold affect each median. Small samples can be changed substantially by one transaction. Newbury Park and Thousand Oaks are separate MLS city labels here; Westlake Village and other mailing labels do not independently verify county or municipal boundaries.
Not yet. The earlier active-listing export has an unconfirmed as-of date and is not treated as October month-end inventory. This first edition does not calculate months of supply or invent month-over-month or year-over-year changes. Historical comparisons can be added after consistent monthly data is obtained and verified.
No. The reporting month and retrieval date are explicit. The numbers are refreshed after the next MLS file is reviewed; they are not a live data connection.
The Story Behind the Numbers
Connect the figures with practical local market updates and guides for your next purchase or sale.
Selected market articles · Live feed refreshes when this section comes into view.
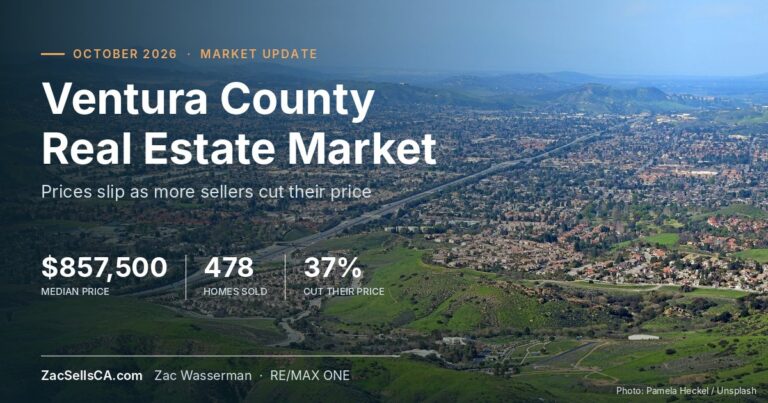
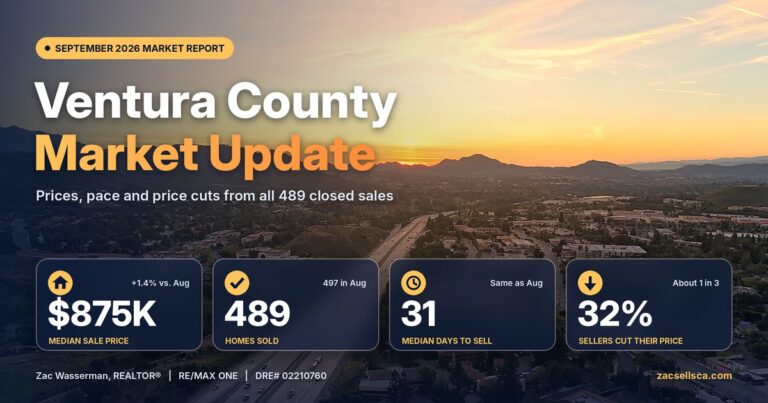

Use these dated articles for additional context. Their geographic coverage, property groups, dates, and source methods can differ from this selected-city report, so their figures may not be directly comparable.
From Research to a Real Plan
Compare the homes, costs, and timing that matter to your plans. Zac can help you connect these monthly figures to a specific property search or sale.
October 2026 closed-sales data · Manually refreshed after each reviewed MLS file · No live feed or historical trend is implied.