
Ventura County Housing Market Q1 2026: What the Data Actually Shows
Quick Answer
The ventura county housing market Q1 2026 story is clear: 1,211 closed sales, a countywide median sale price of $880,000 across all property types, a $955,000 median for single-family homes, 35 median days on market, and a 98.8% sale-to-list ratio. Activity accelerated each month of the quarter, which matters for both buyers and sellers heading into spring.
Q1 2026 is officially closed, and the ventura county housing market Q1 2026 data gives buyers and sellers a much clearer picture than headlines ever do. Countywide, there were 1,211 closed sales, a $880,000 median sale price across all property types, a $955,000 median sale price for single-family homes, 35 median days on market, and a 98.8% sale-to-list ratio. Those are not weak-market numbers, and they are not runaway-overheating numbers either in the ventura county housing market Q1 2026. They point to a market with real demand, active competition in the right price bands, and pricing discipline that still matters.
However, the real story inside the ventura county housing market Q1 2026 is nuance. This is not a one-size-fits-all market, and it is not accurate to call Ventura County purely a buyer’s market or a seller’s market. Instead, it is city-dependent, price-dependent, and condition-dependent. Roughly 26% of homes sold above asking price, which proves that demand is still very real for the right listings. At the same time, 74% sold at or below list price, which tells sellers that the market is still enforcing price discipline. In other words, strong homes still win, but sloppy pricing is getting exposed fast in the ventura county housing market Q1 2026.
Ventura County Housing Market Q1 2026 — The Headline Numbers
| Metric | Q1 2026 |
|---|---|
| Total Closed Sales | 1,211 |
| Median Sale Price (All Types) | $880,000 |
| Median Sale Price (SFR) | $955,000 |
| Median Days on Market | 35 days |
| Sale-to-List Ratio | 98.8% |
| Median Price Per Sq Ft | $512 |
| Total Sales Volume | $1.31 billion |
| Homes Sold Over Asking | 26% |
Additionally, the topline numbers in the ventura county housing market Q1 2026 matter because they show a market that gained strength as the quarter moved forward. January closed with 333 sales at an $858,000 median price. February improved to 413 sales at an $860,000 median. March finished with 465 sales at a $900,000 median. That is not just a normal seasonal bounce in isolation. It is meaningful momentum in both volume and pricing, and it suggests that the spring market entered April with real energy.
Furthermore, this quarter supports what many serious market participants were already feeling on the ground: well-located, well-presented, realistically priced homes continued to attract action, while homes that chased the market or leaned too hard on emotional pricing lost leverage. That is why the 98.8% sale-to-list ratio is so important. It is close enough to full price to tell you sellers still hold negotiating power in many situations, but not so high that buyers are getting steamrolled across the board.
As a result, anyone trying to understand the ventura county housing market Q1 2026 should stop thinking in broad national terms and focus on local behavior instead. The local trend line points toward a firmer spring market, especially when you compare Q1 data against expectations laid out in the 2026 Ventura County housing market forecast. If you are buying or selling in Ventura County, this is exactly the kind of quarter that rewards preparation more than guesswork.
Median Home Price by City — Ventura County Q1 2026
| City | Median SFR Price | Median DOM | Median $/SqFt | Q1 SFR Sales |
|---|---|---|---|---|
| Bell Canyon | $2,775,000 | 20 days | $413 | 6 |
| Lake Sherwood | $2,700,000 | 22 days | $785 | 7 |
| Westlake Village | $1,740,000 | 31 days | $698 | 33 |
| Somis | $1,520,000 | 21 days | $533 | 7 |
| Oak Park | $1,295,000 | 21 days | $569 | 19 |
| Ojai | $1,225,000 | 51 days | $711 | 37 |
| Thousand Oaks | $1,187,000 | 27 days | $548 | 102 |
| Newbury Park | $1,077,000 | 38 days | $542 | 61 |
| Moorpark | $1,032,500 | 35 days | $444 | 58 |
| Camarillo | $984,250 | 23 days | $501 | 106 |
| Oak View | $967,500 | 28 days | $728 | 8 |
| Ventura | $913,623 | 34 days | $567 | 105 |
| Simi Valley | $849,500 | 40 days | $501 | 190 |
| Fillmore | $822,950 | 58 days | $378 | 18 |
| Oxnard | $822,500 | 17 days | $516 | 118 |
| Santa Paula | $742,500 | 34 days | $452 | 26 |
| Port Hueneme | $598,750 | 53 days | $468 | 14 |
Notably, the city-level view is where the ventura county housing market Q1 2026 becomes much more useful. Median prices ranged from $598,750 in Port Hueneme to $2,775,000 in Bell Canyon. That spread is exactly why broad county averages only tell part of the story. A buyer shopping in Fillmore is operating in a very different value equation than a buyer targeting Westlake Village, Lake Sherwood, or Ojai. Likewise, a seller in Camarillo cannot price the same way as a seller in Oak View or Bell Canyon and expect the same market response.
In particular, Simi Valley was the highest-volume single-family market in Q1 with 190 SFR sales. That matters because high volume tends to provide clearer pricing signals, more reliable comparable sales, and a more readable trend line for both buyers and sellers. Simi Valley’s $849,500 median price, 40 median days on market, and $501 median price per square foot position it as one of the most important data points in the broader ventura county housing market Q1 2026 conversation. It remains one of the county’s largest and most active trade-up and move-in buyer markets.
Beyond that, Oxnard posted the fastest median time to sell in the county at 17 days, which is extremely important. Speed like that usually reflects a combination of demand, price alignment, and product-market fit. It tells buyers they cannot assume every opportunity will sit, and it tells sellers that certain submarkets in the ventura county housing market Q1 2026 still reward strong execution very quickly. Camarillo also stood out with 106 SFR sales and just 23 median days on market, showing an impressive mix of volume and velocity.
Meanwhile, Ojai’s $1,225,000 median price and premium $711 price per square foot reflect the staying power of lifestyle-driven demand. Buyers are still willing to pay for scarcity, character, and location identity. Ventura itself stayed active at 105 SFR sales, a $913,623 median price, and 34 median days on market, reinforcing its role as one of the county’s core markets. If you are comparing areas, this is where neighborhood-level context matters too, especially when paired with Zac’s guide to the best neighborhoods in Ventura County.
What Q1 2026 Means for Home Sellers in Ventura County
Additionally, the clearest takeaway for sellers in the ventura county housing market Q1 2026 is that price discipline is not optional. A countywide 98.8% sale-to-list ratio is strong, but it does not mean the market is forgiving. It means homes that are priced correctly are still attracting serious buyers and closing close to ask. It also means the market is quickly exposing listings that are late to the trend, over-improved for the neighborhood, or simply launched above where buyer demand can support them. In practical terms, the homes priced right are generally the ones moving in the 17-to-35-day range. The homes priced wrong are the ones stretching into 50-plus days and losing leverage.
Furthermore, the fact that 26% of homes sold above asking price should be encouraging, but sellers need to interpret that number correctly. Multiple-offer situations still exist in the ventura county housing market Q1 2026, but they are concentrated in homes that show well, photograph well, feel turnkey, and enter the market at a price buyers can justify. Over-asking sales are not random. They tend to happen where demand outruns supply in a specific band, not because the market is rewarding every seller equally.
As a result, launch strategy matters more than ever. The jump from 333 closed sales in January to 413 in February and then 465 in March confirms that spring demand was building all quarter. Sellers who enter the market prepared have a real opportunity to benefit from that momentum. That means better pre-listing positioning, stronger pricing discipline, sharper photography, tighter showing preparation, and a plan built around what buyers in your exact city are doing right now. It also means avoiding the common mistakes covered in guides like Q1 market conditions and broader seller education posts that explain why some homes miss the market window.
Consequently, sellers should think in terms of data-backed positioning, not hope-based pricing. The ventura county housing market Q1 2026 is still giving strong sellers real opportunity, especially in faster-moving segments like Oxnard, Camarillo, Thousand Oaks, and parts of Ventura. If you are also weighing issues like coverage costs or insurability before listing, Zac’s guide to wildfire risk and home insurance in Ventura County is worth reviewing as part of your prep. Thinking about listing? Call Zac at 805.212.9147 or request a free home valuation.
What Q1 2026 Means for Home Buyers in Ventura County
However, buyers should not read the ventura county housing market Q1 2026 data as a sign that they are out of room to negotiate or think carefully. The countywide 35-day median days on market still suggests that many buyers have enough time to assess value, compare options, and avoid panic moves. That said, buyers also cannot move casually in every submarket. Oxnard at 17 days, Camarillo at 23 days, and Thousand Oaks at 27 days are reminders that desirable homes in active price bands can still move fast. The opportunity is there, but readiness matters.
In contrast, one of the most helpful buyer insights inside the ventura county housing market Q1 2026 is the price-per-square-foot range across the county. Fillmore came in at $378 per square foot, while Lake Sherwood reached $785 per square foot. That range helps buyers quickly understand relative value, budget stretch, and lifestyle tradeoffs. It also reinforces why county averages can be misleading if you are not filtering for city, neighborhood, and home type. Buyers who want more space for the money may look at markets like Fillmore, Moorpark, Santa Paula, or parts of Simi Valley. Buyers prioritizing prestige, schools, gated communities, or luxury amenities may naturally filter into Westlake Village, Lake Sherwood, or Bell Canyon.
Notably, the $955,000 median single-family price in the ventura county housing market Q1 2026 still fits into the broader financing conversation for many buyers, especially when paired with the current 2026 conforming loan limits. Financing strategy is a huge part of competitiveness now. Buyers who understand payment, reserves, closing costs, and approval strength ahead of time can move decisively when the right property shows up. That is also why it helps to review Zac’s pages on how much house can I afford and the step-by-step home buying guide.
Beyond that, buyers need to think about the full cash picture, not just the purchase price. Closing costs, insurance, reserves, and commute-driven lifestyle decisions can all affect what makes sense. That is especially true for people moving to Ventura County from LA and trying to compare value beyond sticker price. For a more complete budget framework, review Zac’s guide to closing costs in Ventura County. If you want buyer guidance tailored to your target city and budget, call or text 805.212.9147 or visit the contact page.
Property Type Breakdown — SFR, Condos & Townhomes
| Property Type | Q1 2026 Sales |
|---|---|
| Single-Family Residence | 925 |
| Condominium | 181 |
| Townhouse | 91 |
| Other (Duplex, Multi) | 14 |
Additionally, the ventura county housing market Q1 2026 was still overwhelmingly driven by single-family homes. With 925 SFR sales, detached housing accounted for roughly 76% of all volume. That is important because the single-family market still sets the emotional tone for most buyers and sellers. It shapes move-up demand, family relocation decisions, and much of the county’s pricing psychology. When people say “the market,” they are usually describing the single-family segment whether they realize it or not.
Meanwhile, condos and townhomes remain critical entry-point options inside the ventura county housing market Q1 2026. There were 181 condo sales and 91 townhouse sales in the quarter, which is meaningful volume. The gap between the $880,000 all-types median and the $955,000 SFR median highlights that attached housing still offers a meaningful discount for buyers priced out of detached homes or trying to reduce monthly payment pressure. For many first-time and payment-sensitive buyers, that can make the difference between continuing to rent and stepping into ownership. It is one more reason to think carefully about the long-term math behind rent vs. buy in Ventura County.
Comparing Q1 2026 to Previous Quarters
Furthermore, the ventura county housing market Q1 2026 needs to be viewed in context. Through much of 2025, the market narrative across Ventura County and the San Fernando Valley was shaped by affordability pressure, rate sensitivity, low inventory in desirable bands, and persistent city-by-city variation. What Q1 2026 shows is not a collapse, and it is not an irrational surge. Instead, it shows a market that has stayed surprisingly resilient. Prices held firm, the countywide sale-to-list ratio stayed near full price at 98.8%, and closings accelerated as the quarter progressed.
Consequently, March’s jump to 465 closings is one of the most important signals in the ventura county housing market Q1 2026. That kind of late-quarter strengthening typically indicates robust spring activity, especially when paired with an increasing median price from $858,000 in January to $900,000 in March. That does not mean every submarket is equally hot, but it does suggest buyers remained engaged despite affordability challenges. For additional local context, compare this report against Zac’s February 2026 market update and the neighboring San Fernando Valley market update.
However, broader context still matters. Statewide and national housing conditions continue to be shaped by affordability, rate expectations, household formation, and migration patterns. That is why I always recommend balancing local MLS data with reputable third-party resources like the California Association of REALTORS, the National Association of REALTORS, the Consumer Financial Protection Bureau, and the U.S. Census Bureau for demographic and consumer context. Those sources help frame the environment, but the ventura county housing market Q1 2026 data is what tells you how decisions are actually playing out here on the ground.
Ventura County Q1 2026 vs. the San Fernando Valley — How the Markets Compare
Additionally, Ventura County’s $955,000 single-family median gives buyers an important benchmark when comparing options across the region. In many cases, that number compares favorably to nearby San Fernando Valley markets on a price-per-square-foot basis, especially for buyers who want more space, a calmer setting, and a different day-to-day lifestyle. That is a major reason the ventura county housing market Q1 2026 continues to draw attention from buyers who feel priced into tighter tradeoffs closer to Los Angeles. For many households, the value conversation is not just price — it is what that price actually delivers.
In contrast, many San Fernando Valley buyers are often balancing denser neighborhoods, more traffic, and different lifestyle compromises even when headline pricing looks relatively close at first glance. Ventura County cities such as Ventura, Camarillo, Moorpark, and parts of Simi Valley often present a more attractive value equation when you factor in lot size, pace, outdoor access, and overall feel. Buyers trying to compare both regions side by side should review Zac’s San Fernando Valley market update to better understand how those local conditions differ in real time.
Consequently, the decision between Ventura County and the San Fernando Valley often comes down to more than pure affordability. It is also about lifestyle efficiency, resale positioning, and how far each housing dollar stretches once you account for square footage, neighborhood feel, and quality-of-life priorities. Ventura County keeps standing out for buyers who want stronger value without giving up access to Los Angeles job centers. That is exactly why more people keep moving to Ventura County from LA and using side-by-side market data to guide the move.
Ventura County Housing Market Q1 2026 — FAQ
What is the median home price in Ventura County in 2026?
Additionally, if you are asking about the ventura county housing market Q1 2026 at the broadest level, the median closed sale price across all property types in Q1 2026 was $880,000. For single-family residences specifically, the median was $955,000. That distinction matters because attached housing and smaller entry-level inventory pull the all-types number down, while the single-family median better reflects the detached-home market most buyers and sellers focus on. If you are planning around detached homes, the $955,000 figure is usually the more relevant benchmark.
What is the median home price in Ventura, CA in 2026?
Furthermore, in the city of Ventura, the Q1 2026 median sale price for single-family homes was $913,623. The city also posted a $567 median price per square foot and about 34 days on market. That makes Ventura one of the most important benchmark cities in the ventura county housing market Q1 2026, because it offers a blend of coastal demand, lifestyle appeal, and enough sales volume to provide meaningful signals. Buyers relocating from Los Angeles often study Ventura closely because it offers a different pace and value proposition than many coastal LA neighborhoods.
What is the median home price in Simi Valley in 2026?
In particular, Simi Valley posted a Q1 2026 median single-family sale price of $849,500, with a $501 median price per square foot and a 40-day median time on market. Because Simi Valley had 190 SFR sales, it was the highest-volume single-family market in the quarter. That makes it one of the clearest read-throughs for demand in the broader ventura county housing market Q1 2026. For many buyers, Simi Valley continues to represent a major value and lifestyle comparison against Thousand Oaks, Moorpark, Camarillo, and some San Fernando Valley options.
What is the median home price in Thousand Oaks in 2026?
Meanwhile, Thousand Oaks recorded a Q1 2026 median single-family sale price of $1,187,000, with 27 median days on market and a $548 median price per square foot. That combination of pricing and speed tells you Thousand Oaks remained one of the county’s stronger move-up markets in the ventura county housing market Q1 2026. It tends to attract buyers looking for strong neighborhood identity, established housing stock, and a quality-of-life profile that competes well with both Ventura County and west San Fernando Valley alternatives.
How long does it take to sell a home in Ventura County in 2026?
Consequently, the countywide median days on market for homes sold in Q1 2026 was 35 days. But the city-by-city spread inside the ventura county housing market Q1 2026 was wide. Oxnard moved fastest at a 17-day median, while Fillmore and Port Hueneme were slower at 58 days and 53 days respectively. That spread matters because timing affects negotiation strategy, pricing expectations, contingency planning, and how quickly buyers need to act. In other words, there is no single countywide answer that replaces local strategy.
Why the Ventura County Housing Market Q1 2026 Data Matters More Than the Headlines
Additionally, what makes the ventura county housing market Q1 2026 report so useful is not just the existence of the numbers. It is the way those numbers cut through broad, often misleading housing narratives. National headlines tend to flatten everything into simple labels like “hot,” “cooling,” or “correction.” Real consumers do not buy and sell in a national market. They buy and sell in specific cities, on specific streets, with specific payment limits and timing needs. That is why an accurate local report is more valuable than a generic outlook. It helps sellers know how aggressively they can position a listing, and it helps buyers understand where speed, flexibility, or patience matters most.
Beyond that, the ventura county housing market Q1 2026 reinforces how powerful local expertise still is. A county median is useful. A city breakdown is better. A neighborhood-by-neighborhood strategy is what actually wins in the field. For example, a seller in Ojai needs a different pricing and presentation approach than a seller in Port Hueneme. A buyer comparing Camarillo to Thousand Oaks should not just be looking at median price; they should also be weighing speed, lifestyle, inventory mix, insurance, commute, and long-term resale positioning. Those are the conversations that create better outcomes.
Notably, this is also why Zac’s broader content ecosystem matters. Buyers and sellers are not making decisions in a vacuum. They are also weighing affordability, commute tradeoffs, relocation patterns, insurance costs, and how Ventura County compares with surrounding markets. That is why it helps to pair the ventura county housing market Q1 2026 report with related resources like the guide to moving to Ventura County from LA, payment planning tools, insurance education, and local city guides. The best decision is rarely based on one metric alone.
As a result, people who use the ventura county housing market Q1 2026 data correctly gain an edge. Sellers can time, price, and prepare more intelligently. Buyers can target the cities where value aligns with budget and lifestyle. Investors and move-up homeowners can compare speed, volume, and pricing power more realistically. That is the difference between reacting to the market and understanding it.
Final Take: Ventura County Housing Market Q1 2026
Ultimately, the ventura county housing market Q1 2026 showed a market that strengthened as the quarter progressed. Volume increased month over month, pricing stayed firm, and the gap between stronger and weaker submarkets remained meaningful. Countywide, buyers still had room to be thoughtful in many situations, but not to be passive. Sellers still had leverage, but only when their homes were positioned correctly. That is the real takeaway from the ventura county housing market Q1 2026: Ventura County is active, balanced, and highly local.
Whether you're buying or selling in Ventura County in 2026, having accurate, current data on your side matters. Zac Wasserman combines on-the-ground local knowledge with a data-driven approach to help buyers and sellers make stronger decisions in the ventura county housing market Q1 2026. Call or text 805.212.9147 or visit zacsellsca.com to get started. You can also keep researching with Zac’s guides to moving to Ventura County from LA and closing costs in Ventura County.
- All Posts
- Buyer Guides
- California Home Insurance & Wildfire Risk
- Home Financing (Mortgage & Loan Guides)
- Market Updates & Forecasts
- Seller Guides
- Back
- Ventura County Real Estate Market Updates
- San Fernando Valley Real Estate Market Updates (Monthly): Prices, Inventory & Trends
Ventura County Mortgage Rates: September 2026 Update September 2026 Mortgage Update Ventura County Mortgage Rates: September 2026 Update Rates have...

Can You Sell an ADU Separately in California? Your 2026 AB 1033 Guide for LA & Ventura County Sell an...
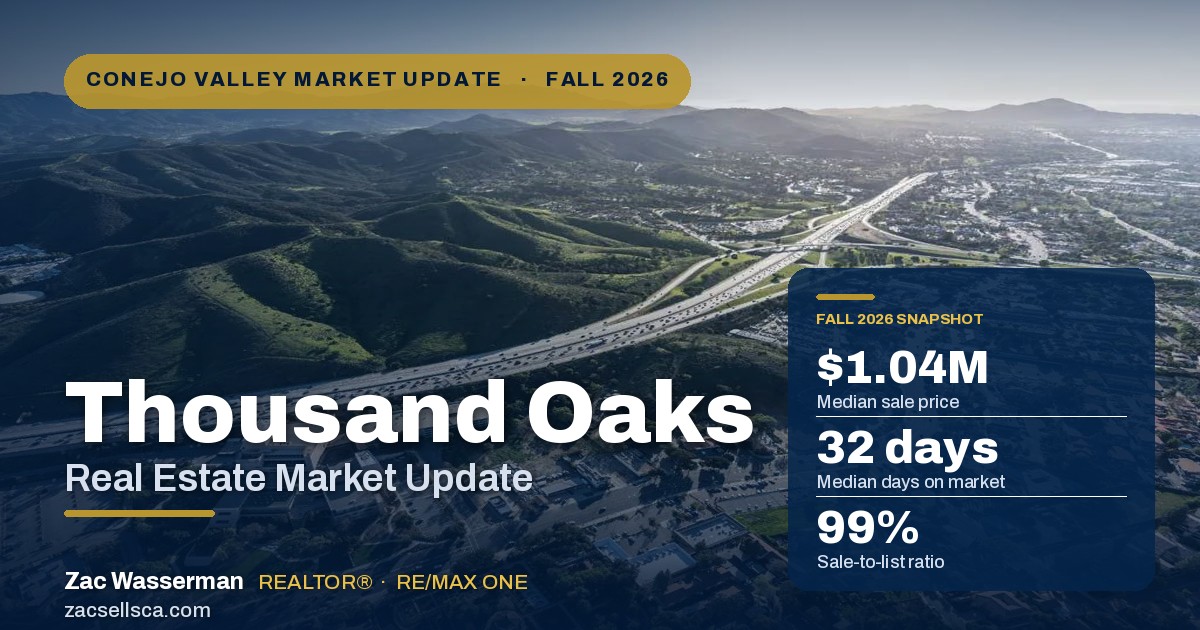
Conejo Valley Market Update · Fall 2026 Thousand Oaks Real Estate Market Update: Fall 2026 Prices remain firm, inventory is...
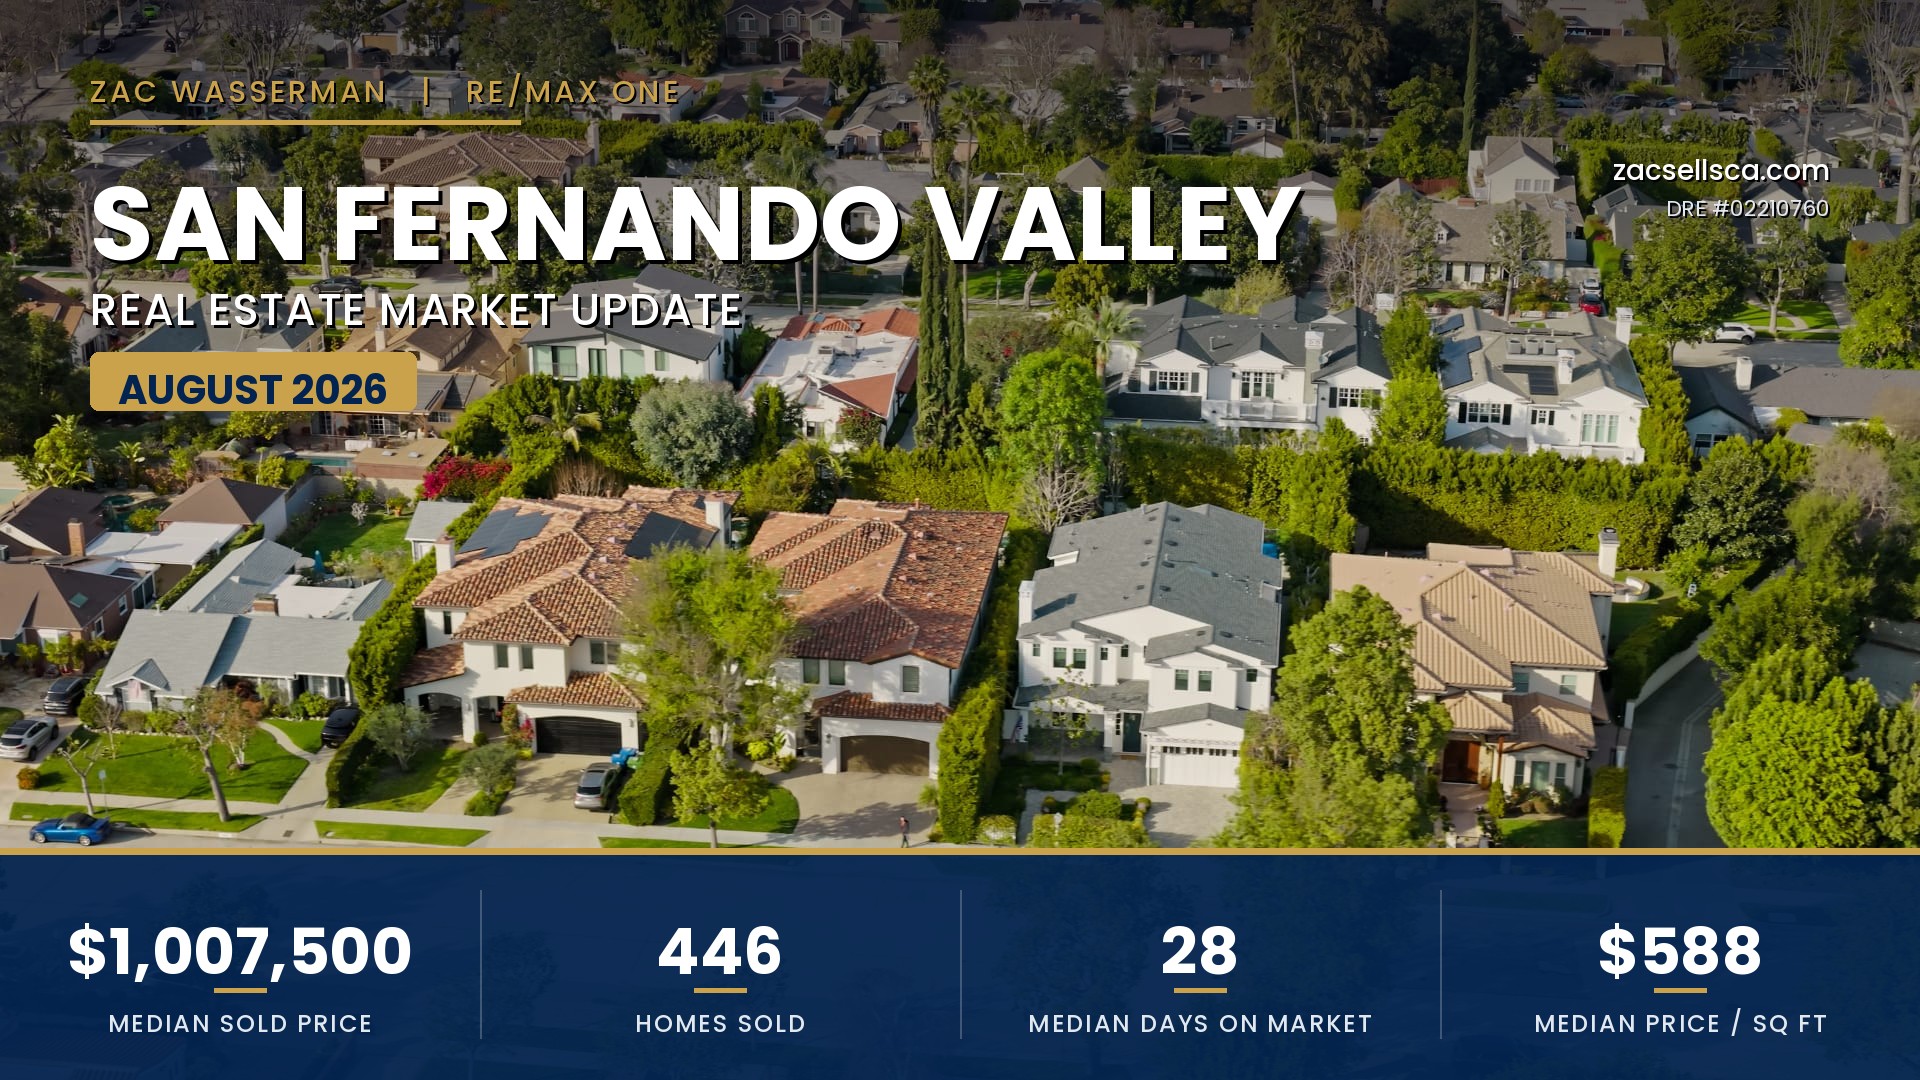
August 2026 • Local Market Report San Fernando Valley Housing Market Update: August 2026 Prices, Trends & City-by-City Data By...
Ventura County Real Estate Market Update: August 2026 Ventura County Market Update — August 2026 Ventura County Real Estate Market...

Ventura County Real Estate Guide • 2026 Ventura County Foreclosures in 2026: How to Buy Smart or Sell Fast A...