
Ventura County Housing Market 2026: Prices, Rates & Forecast

What should buyers and sellers expect from the Ventura County housing market in 2026? This forecast breaks down median home prices, mortgage rates, inventory trends, and what may happen next across Camarillo, Thousand Oaks, Oxnard, Ventura, Simi Valley, Moorpark, and Westlake Village.
Why Your House Isn’t Selling in Ventura & LA County (2026 Guide)

If your home is sitting on the market in Ventura County or nearby LA County communities, the problem is usually bigger than timing alone. This 2026 guide breaks down the six biggest reasons homes are not selling — including price, presentation, photos, buyer targeting, marketing, and repair issues — plus how to reset a stale listing and attract serious buyers.
SFV Market Update — February 2026: What Changed + Who Has Leverage Now
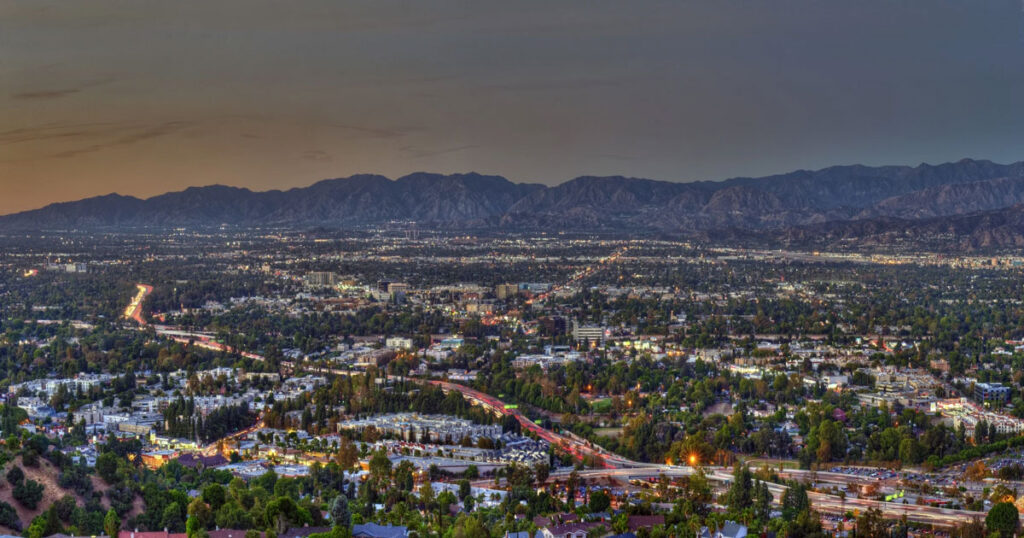
SFV Market Update Feb 2026: Prices, DOM & Leverage LAST UPDATED: February 28, 2026 San Fernando Valley Real Estate Market February 2026: What Changed + Who Has Leverage Looking for a clear San Fernando Valley real estate market February 2026 update? Below is a fast, skimmable snapshot of prices, inventory, days on market, and sale-to-list trends—plus what it means if you’re buying in the next 0–6 months or considering selling in the next 0–12. Snapshot + Takeaway (SFV — February 2026) Skimmable stats + what it means Median / Avg Price$920,000 / $1,115,000 Active Listings642 New Listings378 Sold Homes284 Median DOM28 Sale-to-List99.2% Trend to watch next month: Watch whether new listings continue outpacing sales—if inventory builds while DOM stays stable, buyer leverage may expand. What it means for sellers If DOM is 28 days and sale-to-list is 99.2%, the market is rewarding listings that are priced correctly early. The biggest risk is overpricing, going stale, and negotiating from behind. What it means for buyers If inventory is 642 active listings and DOM is 28 days, leverage depends on micro-area and condition. Your edge comes from payment realism and targeting listings where time-on-market is stretching. Local proof: I publish market updates designed to be decision-useful—focused on inventory, DOM, and sale-to-list because those are the levers that shift negotiating outcomes. Share your neighborhood + timeline and I’ll help you interpret the San Fernando Valley real estate market February 2026 stats for your micro-market segment. Simple qualifier to add to your form: Timeline: 0–3 months / 3–6 / 6–12 / just researching Weekly Market Email Weekly stats + what changed — no spam. Get the SFV market email once a week: the stats that moved, what changed, and what to watch next—so you’re not relying on headlines. Get Weekly SFV Updates Subscribe to the Market Email Thank you promise: One weekly email with the latest stats + a short “what changed” note—no spam. Home Value Report SFV only — comps-based range, not a generic estimate. Considering selling in the next 0–12 months? Get a comps-based SFV value range that accounts for condition, upgrades, and current competition. Request My SFV Value Range Get a Home Value Report Thank you promise: I’ll send a comps-based range and the key pricing factors buyers will compare you against. Buyer Buyability Call Best if you’re buying in the next 0–6 months. Buying soon? Do a quick buyability check—price range, payment range, and offer-readiness so you shop with confidence. Book a Buyability Call Confirm My Buying Range Thank you promise: You’ll leave with a clear buying-power range and the next two steps to get offer-ready. San Fernando Valley February 2026 Market Metrics A quick visual read on the core SFV numbers shaping buyer leverage, seller expectations, and overall market pace. Median Sold Price $920,000 Average Sold Price $1,115,000 Active Listings 642 New Listings 378 Closed Sales 284 Median Days on Market 28 Sale-to-List Ratio 99.2% MoM / YoY (Median) +1.8% / +3.7% These bars are scaled for quick visual comparison within each chart, so they are best used as a directional snapshot rather than a strict cross-metric ratio analysis. Top SFV Areas by Closed Sales Which SFV pockets drove the most transaction volume in February 2026. Sherman Oaks 52 Encino 44 Studio City 38 Woodland Hills 36 Northridge 31 Placed directly below the snapshot and CTA row so the charts stay above the fold and support quick scanning before the deeper market breakdown. San Fernando Valley Real Estate Market February 2026: Complete Market Snapshot Metric February 2026 Median price $920,000 Average price $1,115,000 Active listings 642 New listings 378 Sold homes (closed sales) 284 Median days on market (DOM) 28 Sale-to-list ratio 99.2% MoM change (median price) +1.8% YoY change (median price) +3.7% How to use this SFV snapshot The “right” interpretation depends on segment. In the San Fernando Valley real estate market February 2026, the most reliable way to apply these numbers is to use them as a baseline, then overlay three micro-market questions: (1) What are the closest comps in your neighborhood for similar condition and lot size? (2) How quickly are those comps going pending relative to the 28-day median? (3) Are closed sales landing near list (99.2%) or are they consistently closing lower because of concessions? Buyers can use the snapshot to decide where to negotiate (homes above the median DOM and those with recurring price reductions). Sellers can use it to decide how aggressive to be on pricing and terms: when sale-to-list stays near parity, the “best” listings are still clearing close to ask, but the market corrects overpricing quickly. San Fernando Valley Real Estate Market February 2026: Price Trends & Momentum February pricing doesn’t just answer “up or down”—it shows whether buyers are paying up for the best homes or negotiating harder on anything with friction. In the San Fernando Valley real estate market February 2026, the median at $920,000 and average at $1,115,000 point to segmentation: premium closings can lift the average even when most buyers are still shopping under $1M. The San Fernando Valley real estate market February 2026 pricing data shows the market rewarding quality and penalizing overreach. Upper-end sales in areas like Studio City and Encino helped pull the $1,115,000 average higher, while the $920,000 median reflects the more attainable core of the market. This gap between median and average is important: it means sellers can’t rely on countywide headlines when pricing—they need recent comps that match their specific segment, condition, and micro-location within the Valley. Practically, this means two different buyers can have two completely different experiences in the same month: a turnkey home in a premium pocket may attract multiple strong offers, while a similar-priced home with condition or location friction can sit and invite concessions. Reading price without pace (DOM) and final terms (sale-to-list) is where most people get misled. For national housing market context, see the National Association of REALTORS® existing home sales data. Local money-page context: If your budget lands near conforming vs
Ventura County Real Estate Market Update — February 2026: Prices, Sales & Days on Market
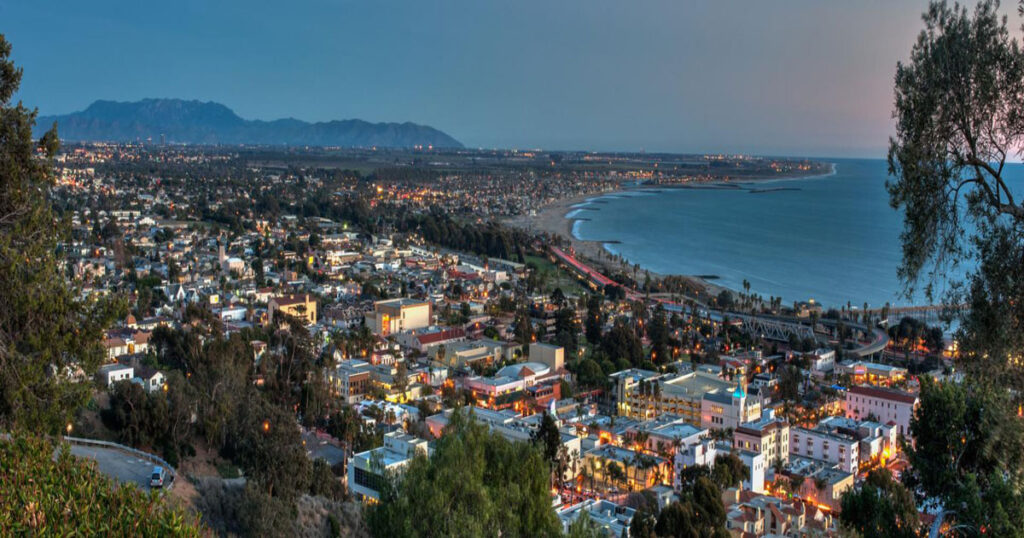
Ventura County real estate market update for February 2026: median sold price came in at $875,150 with 403 closed sales and a median 33 days on market. Here’s what the latest local pricing and pace signals mean for buyers, sellers, and the month ahead.
Closing Costs 2026 Ventura Los Angeles: Title, Escrow, Taxes & Credits (Cash-to-Close)
Estimate cash-to-close fast: Closing Costs 2026 Ventura Los Angeles broken down by escrow, title, taxes, and credits—plus real $ examples at $500k, $800k, and $1.2M.
2026 Loan Limits Ventura Los Angeles: Conforming vs Jumbo (With Buying Power Examples)

2026 loan limits Ventura Los Angeles—see conforming vs jumbo caps, what changes at the limit, and buying power examples with down-payment strategies.
How Much House Can I Afford in Los Angeles? (2026 Buying Power Guide)

How much house can I afford in Los Angeles in 2026? Use DTI (28/36), down payment impact, and LA costs (tax, insurance, HOA) to find your real price range.
How Much House Can I Afford in Ventura County? (2026 Guide + Payment Examples)
How much house can I afford in Ventura County in 2026? Use the 28/36 rule, DTI math, and real payment breakdowns by income to estimate a comfortable price range before you shop.
Earthquake Insurance 2026 — Ventura & LA (CEA vs. Private) + Condo/HOA Considerations

Earthquake insurance 2026 guide for Ventura & LA: compare CEA vs private options, deductible math, and condo/HOA master policy coverage gaps.
Home Insurance 2026: FAIR Plan + DIC, VHFHSZ Maps & What Buyers Must Do (Ventura & LA Counties)
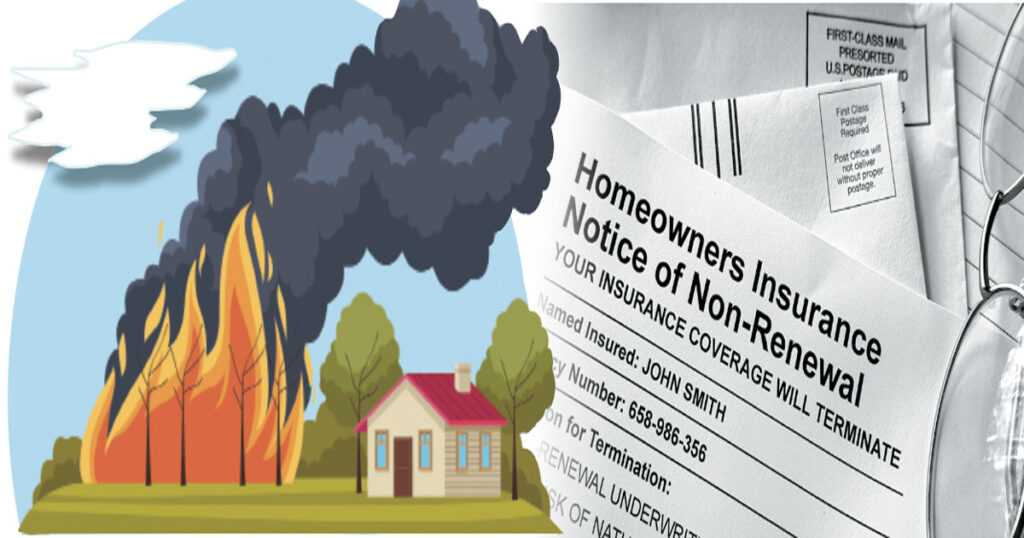
Home insurance 2026 guide: FAIR Plan + DIC coverage, VHFHSZ maps, carrier pullouts. Essential for California buyers, sellers & homeowners in Ventura/LA.
San Fernando Valley Real Estate Market Update January 2026)
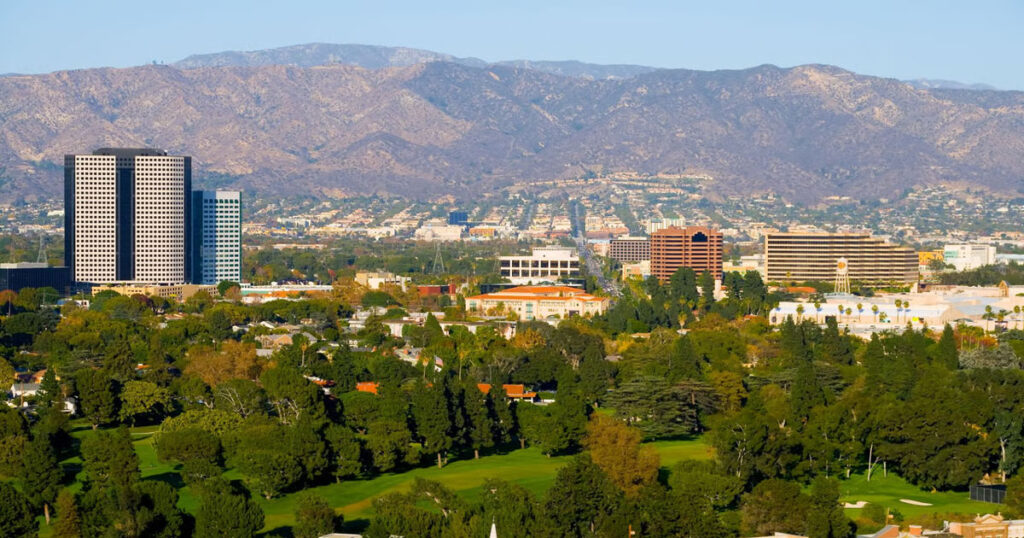
San Fernando Valley real estate market update for January 2026: MLS-driven prices, inventory, months of supply, days on market, sale-to-list, and city-by-city highlights—plus clear buyer/seller strategy for the next 30–90 days.
Ventura County Real Estate Market Update (Jan 2–Feb 2, 2026): Prices, Inventory & What It Means

Ventura County real estate market update for January 2026. Median price $859,750, 1,035 active listings, 3.1 months of supply, and 46-day median DOM—plus city-by-city insights for Camarillo, Thousand Oaks, Westlake Village, Oxnard, Ventura, Moorpark, and Simi Valley.
ADU Standard Plans Ventura County – Los Angeles 2026: Free vs LADBS
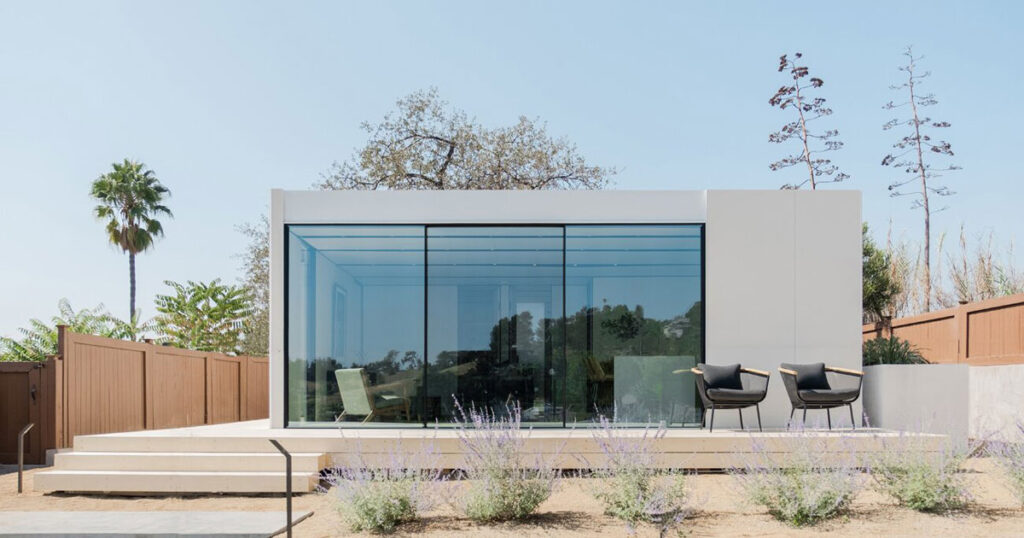
Ventura’s free standard plan sets and LA’s LADBS Standard Plan Program can cut plan-check time in 2026. Here’s what’s pre-approved, what still gets reviewed, and what it really costs.
Insurance & Flood Maps After the January Storms: Ventura vs. LA Buyer Playbook (2026)
A practical 2026 buyer playbook for Ventura County and Los Angeles County after the January storms: how to check flood zones, understand what insurance does (and doesn’t) cover, and avoid lender/escrow delays with the right timing and questions.
Home Insurance 2026: Ventura & Los Angeles (FAIR Plan + DIC Guide)

Buying near brush in Ventura or LA? This 2026 guide breaks down FAIR Plan + DIC, how to check VHFHSZ maps, lender timing, and a 7-step checklist to keep escrow on track.